\n
## Scatter Plot: Accuracy vs. Time-to-Answer
### Overview
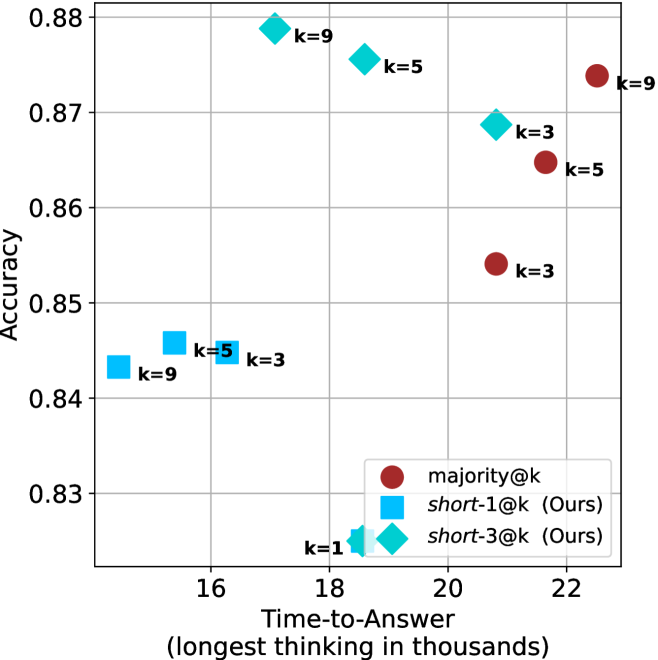
This image presents a scatter plot comparing the accuracy and time-to-answer for different values of 'k' across three methods: majority@k, short-1@k (labeled "Ours"), and short-3@k (labeled "Ours"). The x-axis represents Time-to-Answer in thousands of units, and the y-axis represents Accuracy. Each point on the plot represents a specific combination of method and 'k' value.
### Components/Axes
* **X-axis:** Time-to-Answer (longest thinking in thousands) - Scale ranges from approximately 15.5 to 22.5.
* **Y-axis:** Accuracy - Scale ranges from approximately 0.83 to 0.88.
* **Legend:** Located in the bottom-right corner.
* **majority@k:** Represented by red circles.
* **short-1@k (Ours):** Represented by blue squares.
* **short-3@k (Ours):** Represented by teal diamonds.
* **Data Points:** Each point is labeled with its corresponding 'k' value.
### Detailed Analysis
Let's analyze each data series individually:
**1. majority@k (Red Circles):**
* The points show an increasing trend in accuracy as 'k' increases.
* k=3: Approximately (21.5, 0.855)
* k=5: Approximately (21.8, 0.865)
* k=9: Approximately (22.2, 0.875)
**2. short-1@k (Ours) (Blue Squares):**
* The points show a decreasing trend in accuracy as 'k' increases.
* k=1: Approximately (17.5, 0.83)
* k=5: Approximately (16.2, 0.845)
* k=9: Approximately (16.0, 0.84)
**3. short-3@k (Ours) (Teal Diamonds):**
* The points show a decreasing trend in accuracy as 'k' increases.
* k=1: Approximately (18.2, 0.86)
* k=3: Approximately (19.5, 0.87)
* k=5: Approximately (20.0, 0.875)
* k=9: Approximately (20.5, 0.88)
### Key Observations
* The 'majority@k' method consistently achieves the highest accuracy, and its accuracy increases with 'k'.
* Both 'short-1@k' and 'short-3@k' methods exhibit a trade-off between accuracy and time-to-answer. As 'k' increases, the time-to-answer decreases, but the accuracy also decreases.
* 'short-3@k' generally outperforms 'short-1@k' in terms of accuracy, but at the cost of a slightly longer time-to-answer.
* The 'short-3@k' method with k=9 achieves the highest accuracy (approximately 0.88) and is comparable to the 'majority@k' method with k=9.
### Interpretation
The data suggests that increasing the value of 'k' in the 'majority@k' method improves accuracy, but it also increases the time-to-answer. The 'short-1@k' and 'short-3@k' methods offer a trade-off, allowing for faster response times at the expense of some accuracy. The 'short-3@k' method appears to be a better choice than 'short-1@k' when accuracy is a priority. The fact that 'short-3@k' with k=9 reaches a similar accuracy level to 'majority@k' with k=9 is a significant finding, indicating that the 'short-3@k' method can achieve comparable performance with a potentially different computational cost. The plot demonstrates the relationship between model complexity (represented by 'k'), computational cost (represented by Time-to-Answer), and performance (represented by Accuracy). The "Ours" label suggests these are novel methods being proposed and evaluated against a baseline ("majority@k").