## Heatmap: Comparison of Text Similarity Metrics
### Overview
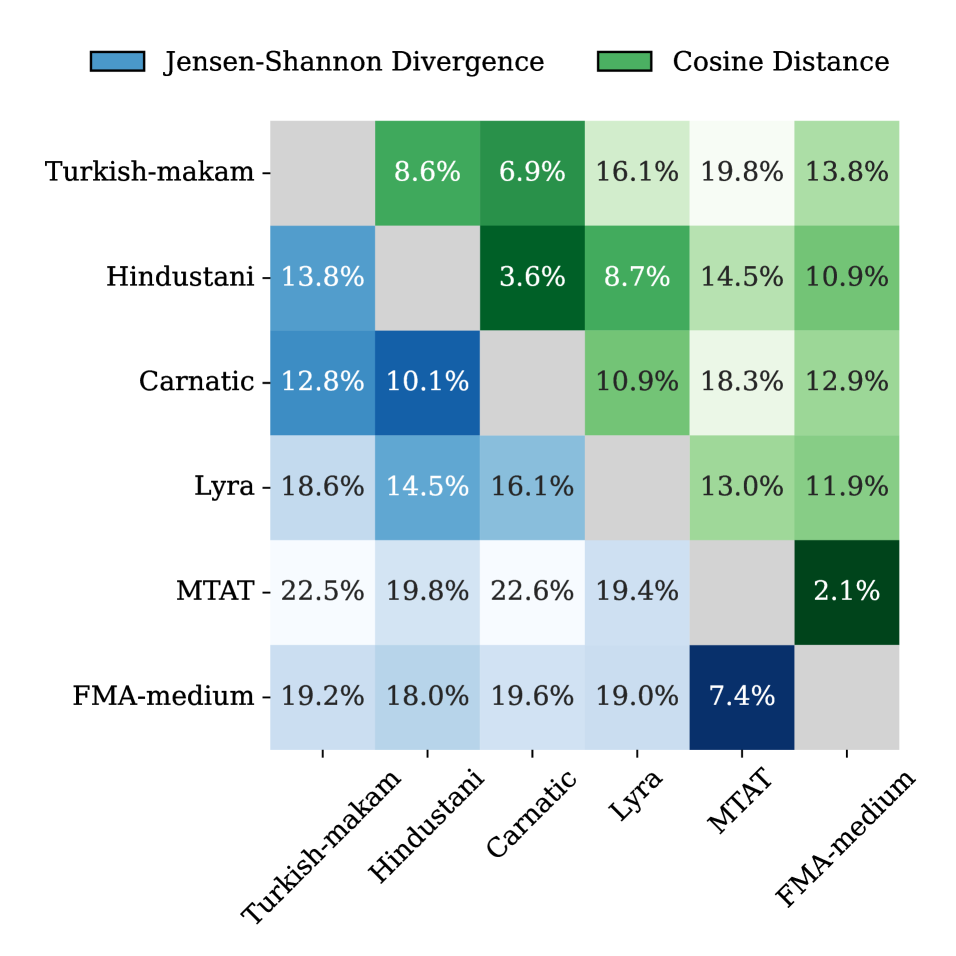
The image is a heatmap comparing six text similarity metrics (Turkish-makam, Hindustani, Carnatic, Lyra, MTAT, FMA-medium) using two distance measures: Jensen-Shannon Divergence (blue) and Cosine Distance (green). Values represent percentage differences between metric pairs, with darker colors indicating higher divergence/distance.
### Components/Axes
- **X/Y Axes**: Labeled with the six metrics (Turkish-makam, Hindustani, Carnatic, Lyra, MTAT, FMA-medium).
- **Legend**:
- Blue squares = Jensen-Shannon Divergence
- Green squares = Cosine Distance
- **Values**: Percentages (0–22.6%) embedded in cells, with empty diagonal cells (self-comparisons).
### Detailed Analysis
#### Jensen-Shannon Divergence (Blue)
- **Highest Value**: MTAT vs MTAT (22.6%)
- **Lowest Value**: Hindustani vs Hindustani (3.6%)
- **Trend**: Diagonal cells (self-comparisons) are empty. Off-diagonal values show MTAT consistently has the highest divergence (e.g., MTAT vs Hindustani: 19.8%, MTAT vs Carnatic: 22.5%).
#### Cosine Distance (Green)
- **Highest Value**: Turkish-makam vs MTAT (19.8%)
- **Lowest Value**: MTAT vs MTAT (2.1%)
- **Trend**: Diagonal cells are empty. Turkish-makam shows the highest distance to MTAT, while MTAT has the smallest self-distance.
### Key Observations
1. **MTAT Dominance**: MTAT has the highest Jensen-Shannon Divergence (22.6%) and lowest Cosine Distance (2.1%) when compared to itself, suggesting it is the most variable metric.
2. **Turkish-makam vs MTAT**: The largest Cosine Distance (19.8%) indicates these metrics are the most dissimilar.
3. **Diagonal Gaps**: Empty diagonal cells imply self-comparisons are excluded or normalized to 0.
4. **Color Consistency**: Blue (Jensen-Shannon) and green (Cosine) values align with legend expectations (e.g., MTAT’s high blue values match its high divergence).
### Interpretation
The heatmap reveals that **MTAT** is the most variable metric (highest Jensen-Shannon Divergence) and most consistent within itself (lowest Cosine Distance). **Turkish-makam** and **MTAT** are the most dissimilar (highest Cosine Distance). The absence of diagonal values suggests self-comparisons are excluded, focusing on inter-metric differences. This could reflect how these metrics capture distinct linguistic or structural features in text analysis.