## Time Series Chart: GOLD/USD vs. S&P500
### Overview
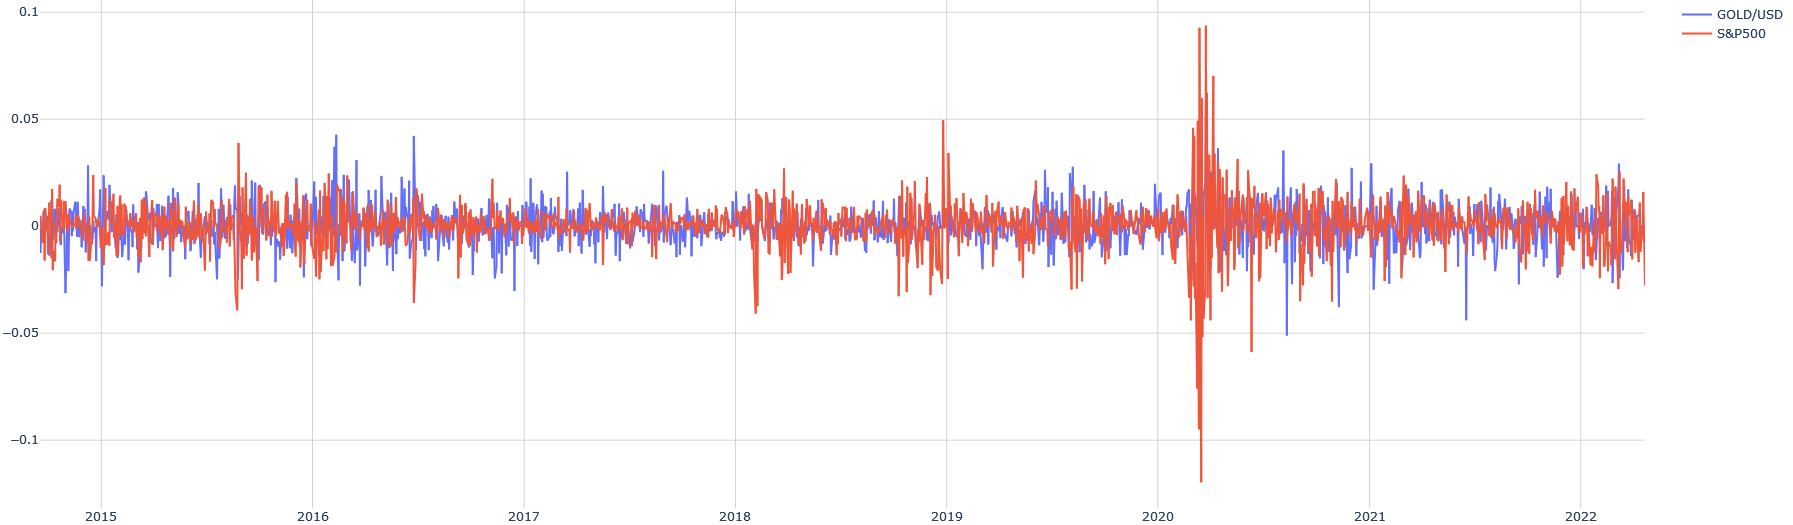
The image is a time series chart comparing the fluctuations of GOLD/USD and S&P500 from 2015 to 2022. The chart displays the daily changes of the two assets over time.
### Components/Axes
* **X-axis:** Time, labeled with years from 2015 to 2022.
* **Y-axis:** Values ranging from -0.1 to 0.1, with increments of 0.05.
* **Legend (Top-Right):**
* Blue line: GOLD/USD
* Red line: S&P500
### Detailed Analysis
* **GOLD/USD (Blue Line):**
* General Trend: Fluctuates around 0, showing volatility over time.
* 2015-2019: Relatively stable fluctuations between approximately -0.02 and 0.02.
* 2020: Experiences a significant drop to approximately -0.07, followed by a sharp recovery.
* 2021-2022: Continues to fluctuate, with peaks and valleys generally within the -0.04 to 0.04 range.
* **S&P500 (Red Line):**
* General Trend: Similar to GOLD/USD, fluctuates around 0, indicating volatility.
* 2015-2019: Fluctuations are generally between -0.02 and 0.02.
* 2020: Shows a dramatic drop to approximately -0.1, followed by a rapid spike to around 0.09.
* 2021-2022: Continues to fluctuate, with peaks and valleys generally within the -0.03 to 0.03 range.
### Key Observations
* Both GOLD/USD and S&P500 exhibit significant volatility, particularly around 2020.
* The S&P500 shows a more pronounced spike in volatility in 2020 compared to GOLD/USD.
* Both assets generally fluctuate within a narrow range, but experience occasional extreme deviations.
### Interpretation
The chart illustrates the daily changes of GOLD/USD and S&P500 over a seven-year period. The data suggests that both assets experienced increased volatility around 2020, likely due to global events such as the COVID-19 pandemic. The S&P500 appears to have been more significantly impacted by these events, as evidenced by the larger spike in volatility compared to GOLD/USD. The fluctuations in both assets indicate the dynamic nature of financial markets and the potential for both gains and losses. The data does not provide information about the underlying causes of the fluctuations, but it highlights the importance of monitoring market trends and managing risk.