## Diagram: Neural Network Memory Analysis
### Overview
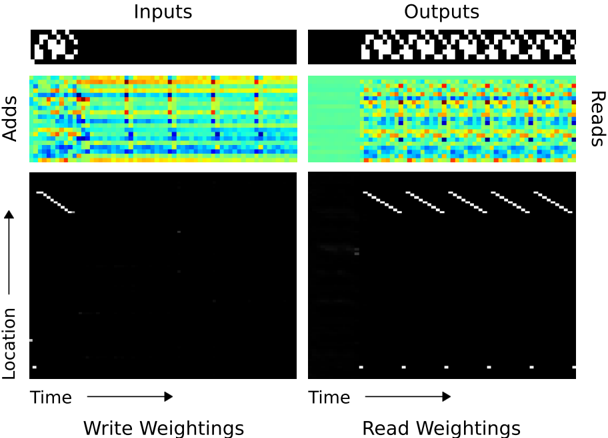
The image presents a visualization of the internal operations of a neural network, specifically focusing on memory access patterns during write and read operations. It displays input and output patterns, memory addition patterns, and write/read weighting distributions over time and location.
### Components/Axes
* **Titles:** "Inputs" (top-left), "Outputs" (top-right)
* **Y-axis (left side):** "Adds", "Location" (with an upward-pointing arrow indicating direction)
* **X-axis (bottom):** "Time" (with a rightward-pointing arrow indicating direction)
* **Bottom Labels:** "Write Weightings" (left), "Read Weightings" (right)
### Detailed Analysis
The image is divided into two main sections: "Inputs" (left) and "Outputs" (right). Each section contains three sub-sections:
1. **Input/Output Patterns (Top Row):**
* **Inputs:** A small, black square with a white pattern.
* **Outputs:** A horizontal sequence of repeating black and white patterns.
2. **Memory Addition Patterns (Middle Row):**
* **Adds (Inputs):** A heatmap-like representation showing memory addition patterns over time. The color scheme ranges from blue to red, indicating different levels of addition. There are vertical bands of varying color intensity.
* **Reads (Outputs):** A heatmap-like representation showing memory read patterns over time. The color scheme ranges from blue to red, indicating different levels of reading. There are vertical bands of varying color intensity.
3. **Write/Read Weightings (Bottom Row):**
* **Write Weightings:** A black background with sparse white pixels. There are diagonal lines of white pixels that appear to move from top-left to bottom-right. There are also a few scattered white pixels.
* **Read Weightings:** A black background with sparse white pixels. There are diagonal lines of white pixels that appear to move from top-left to bottom-right. There are also a few scattered white pixels and a row of white dots at the bottom.
### Key Observations
* The input pattern is static, while the output pattern is dynamic and repetitive.
* The memory addition patterns (Adds/Reads) show distinct temporal structures, with the "Reads" section exhibiting more regular patterns than the "Adds" section.
* The write and read weightings show diagonal patterns, suggesting sequential memory access. The read weightings show more activity than the write weightings.
### Interpretation
The diagram visualizes how a neural network interacts with its memory during processing. The "Inputs" and "Outputs" sections show the data being fed into and produced by the network. The "Adds" and "Reads" sections reveal how the network modifies and retrieves information from its memory. The "Write Weightings" and "Read Weightings" sections illustrate the specific memory locations being accessed during these operations.
The diagonal patterns in the weightings suggest that the network is sequentially accessing memory locations. The differences between the "Adds" and "Reads" sections indicate that the network's memory access patterns are different for writing and reading. The repetitive nature of the output pattern is reflected in the regular patterns observed in the "Reads" section.