## Heatmaps: Neural Network Attention Visualization
### Overview
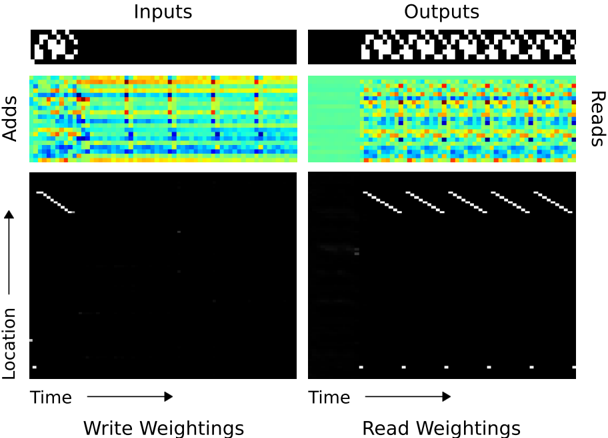
The image presents four heatmaps visualizing attention weights within a neural network. Two heatmaps represent the "Inputs" side, and two represent the "Outputs" side. Each side has two rows: the top row displays attention weights related to "Adds", and the bottom row displays attention weights related to "Location" over "Time". The color intensity represents the magnitude of the attention weight, with warmer colors (red/orange/yellow) indicating higher weights and cooler colors (blue/green) indicating lower weights.
### Components/Axes
* **Titles:** "Inputs" (top) and "Outputs" (right)
* **Row Labels:** "Adds" (top row) and "Location" (bottom row)
* **Column Label:** "Reads" (right side)
* **X-axis:** "Time" (horizontal axis for both sides)
* **Y-axis:** "Location" (vertical axis for the bottom row heatmaps)
* **Color Scale:** Ranges from dark blue (low weight) to red (high weight), passing through green, yellow, and orange.
### Detailed Analysis or Content Details
**Inputs - Adds:**
The heatmap shows a complex pattern of attention weights. The horizontal axis represents time, and the vertical axis represents the location. The heatmap is approximately 20x20 units. The color intensity varies significantly across the heatmap. There are several areas of high attention (red/orange) scattered throughout, with a general trend of decreasing attention as time progresses. The pattern appears somewhat chaotic, with no clear dominant structure. Approximate values (based on color intensity):
* Maximum attention weight: ~90% (bright red)
* Minimum attention weight: ~10% (dark blue)
* Average attention weight: ~50% (green/yellow)
**Inputs - Location:**
This heatmap shows a strong diagonal pattern. The attention weights are highest along the diagonal, indicating that the network attends to locations that are close to each other in time. The diagonal fades as time progresses. The heatmap is approximately 20x20 units.
* Diagonal attention weight: ~80-90% (bright red)
* Off-diagonal attention weight: ~10-20% (dark blue)
**Outputs - Reads:**
Similar to the "Inputs - Adds" heatmap, this shows a complex pattern of attention weights. The heatmap is approximately 20x20 units. There are several areas of high attention (red/orange) scattered throughout, with a general trend of decreasing attention as time progresses. The pattern appears somewhat chaotic, with no clear dominant structure. Approximate values (based on color intensity):
* Maximum attention weight: ~90% (bright red)
* Minimum attention weight: ~10% (dark blue)
* Average attention weight: ~50% (green/yellow)
**Outputs - Read Weightings:**
This heatmap also exhibits a strong diagonal pattern, similar to "Inputs - Location". The attention weights are highest along the diagonal, indicating that the network attends to locations that are close to each other in time. The diagonal fades as time progresses. The heatmap is approximately 20x20 units.
* Diagonal attention weight: ~80-90% (bright red)
* Off-diagonal attention weight: ~10-20% (dark blue)
### Key Observations
* The "Adds" heatmaps (both inputs and outputs) show a more diffuse and complex attention pattern compared to the "Location" heatmaps.
* The "Location" heatmaps (both inputs and outputs) exhibit a clear diagonal pattern, suggesting a temporal locality of attention.
* The attention weights generally decrease over time in all heatmaps.
* The "Inputs" and "Outputs" heatmaps show similar patterns, suggesting that the network's attention mechanism is consistent across the input and output stages.
### Interpretation
The image demonstrates how a neural network attends to different parts of the input sequence over time. The "Adds" heatmaps suggest that the network is attending to a wide range of features and locations, while the "Location" heatmaps suggest that the network is prioritizing temporal locality. The diagonal pattern in the "Location" heatmaps indicates that the network is more likely to attend to locations that are close to each other in time. The decreasing attention weights over time may indicate that the network is focusing on the most recent information.
The visualization provides insights into the network's internal workings and can be used to understand how it makes its predictions. The differences in attention patterns between "Adds" and "Location" suggest that these two features are processed differently by the network. The consistency between "Inputs" and "Outputs" suggests that the attention mechanism is a stable and reliable component of the network.