# Technical Document Analysis: Revisions Majority@128, Varying the Sequential to Parallel Ratio
## 1. Chart Overview
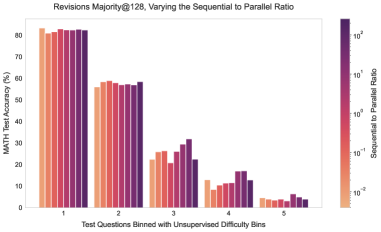
- **Title**: "Revisions Majority@128, Varying the Sequential to Parallel Ratio"
- **Type**: Grouped bar chart with color-coded data series
- **Purpose**: Visualizes MATH test accuracy across difficulty-binned test questions, with performance stratified by sequential-to-parallel computation ratios.
---
## 2. Axes and Labels
### X-Axis
- **Label**: "Test Questions Binned with Unsupervised Difficulty Bins"
- **Categories**: 1, 2, 3, 4, 5 (representing increasing difficulty)
- **Spatial Grounding**: Positioned at the bottom of the chart.
### Y-Axis
- **Label**: "MATH Test Accuracy (%)"
- **Range**: 0% to 80% (logarithmic scale implied by color bar)
- **Spatial Grounding**: Positioned on the left side of the chart.
---
## 3. Legend and Color Bar
- **Legend Title**: "Sequential to Parallel Ratio"
- **Color Scale**: Logarithmic (10⁻² to 10²)
- **Light Orange**: 10⁻² (lowest ratio)
- **Dark Purple**: 10² (highest ratio)
- **Spatial Grounding**: Right side of the chart, adjacent to the bars.
---
## 4. Data Trends and Observations
### Key Trends
1. **Test Question Bin 1**:
- **Accuracy**: Consistently high (75–85%) across all ratios.
- **Color Variation**: Dark purple (10²) to light orange (10⁻²) show minimal accuracy differences.
- **Trend Verification**: Bars are uniformly tall, confirming stable performance regardless of ratio.
2. **Test Question Bin 2**:
- **Accuracy**: Moderate (55–60%) across ratios.
- **Color Variation**: Slight drop in accuracy for darker ratios (10² vs. 10⁻²).
- **Trend Verification**: Bars are shorter than Bin 1 but consistent within the group.
3. **Test Question Bin 3**:
- **Accuracy**: Lower (20–30%) with increasing variability.
- **Color Variation**: Darker ratios (10²) show marginally better performance than lighter ratios.
- **Trend Verification**: Bars decrease in height from left (10⁻²) to right (10²), but differences are subtle.
4. **Test Question Bin 4**:
- **Accuracy**: Very low (5–15%), with significant drops for higher ratios.
- **Color Variation**: Dark purple (10²) bars are shortest, indicating worst performance.
- **Trend Verification**: Steep decline in bar height from left to right.
5. **Test Question Bin 5**:
- **Accuracy**: Near-zero (0–5%) across all ratios.
- **Color Variation**: No meaningful differences; all bars are negligible.
- **Trend Verification**: Uniformly short bars confirm failure regardless of ratio.
---
## 5. Cross-Referenced Legend and Data
- **Legend Validation**:
- Dark purple (10²) corresponds to the tallest bars in Bin 1 and shortest in Bin 4.
- Light orange (10⁻²) aligns with mid-height bars in Bin 2 and Bin 3.
- **Spatial Consistency**: Colors match legend labels across all bins.
---
## 6. Key Insights
- **Performance Degradation**: Accuracy declines sharply with increasing difficulty (Bins 1 → 5).
- **Ratio Impact**:
- Higher sequential-to-parallel ratios (darker colors) maintain better accuracy in easier bins (1–2).
- In harder bins (3–5), higher ratios correlate with worse performance, suggesting diminishing returns or instability.
- **Logarithmic Scale**: The color bar’s logarithmic nature emphasizes extreme ratio values (e.g., 10² vs. 10⁻²).
---
## 7. Missing Elements
- **No Data Table**: Numerical values are inferred from bar heights; exact percentages are not provided.
- **No Footer/Additional Text**: No supplementary annotations or metadata.
---
## 8. Conclusion
The chart demonstrates that test accuracy decreases with increasing question difficulty. While higher sequential-to-parallel ratios improve performance in easier tasks, they may hinder results in harder tasks, highlighting a non-linear relationship between computation strategy and task complexity.