## Stacked Bar Chart: Survey Responses on Genomics Experience, Hypothesis Testing, Education, and Wet Lab Experience
### Overview
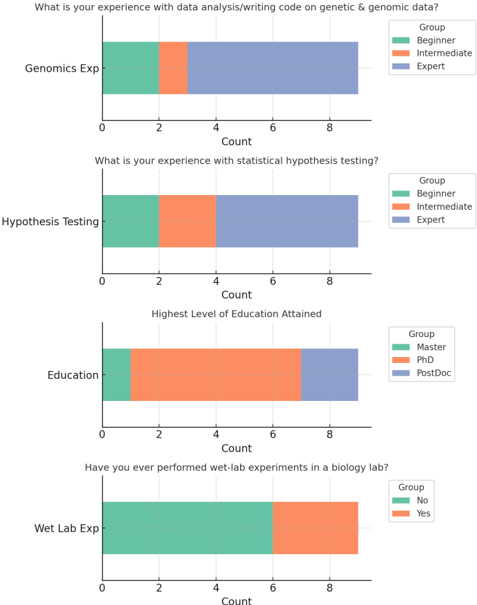
The image presents four stacked bar charts, each representing the distribution of responses to a different survey question. The charts display the counts for different categories within each question, such as experience levels (Beginner, Intermediate, Expert), education levels (Master, PhD, PostDoc), and wet lab experience (Yes, No). The x-axis represents the count of responses, ranging from 0 to 8.
### Components/Axes
* **X-axis:** Count (ranging from 0 to 8, with tick marks at every integer).
* **Y-axis:** Categorical variables representing the survey questions.
* **Legends:** Located on the top-right of the first two charts and on the right of the last two charts, indicating the color-coded categories for each question.
* **Genomics Experience:**
* Beginner (Teal)
* Intermediate (Orange)
* Expert (Blue)
* **Hypothesis Testing:**
* Beginner (Teal)
* Intermediate (Orange)
* Expert (Blue)
* **Education:**
* Master (Teal)
* PhD (Orange)
* PostDoc (Blue)
* **Wet Lab Experience:**
* No (Teal)
* Yes (Orange)
### Detailed Analysis
**1. Genomics Experience:**
* **Question:** "What is your experience with data analysis/writing code on genetic & genomic data?"
* **Categories:** Beginner, Intermediate, Expert
* **Trend:** The number of respondents increases with experience level.
* Beginner: Approximately 2
* Intermediate: Approximately 1
* Expert: Approximately 5
**2. Hypothesis Testing:**
* **Question:** "What is your experience with statistical hypothesis testing?"
* **Categories:** Beginner, Intermediate, Expert
* **Trend:** The number of respondents increases with experience level.
* Beginner: Approximately 2
* Intermediate: Approximately 2
* Expert: Approximately 4
**3. Education:**
* **Question:** "Highest Level of Education Attained"
* **Categories:** Master, PhD, PostDoc
* **Trend:** The majority of respondents have a PhD.
* Master: Approximately 1
* PhD: Approximately 6
* PostDoc: Approximately 1
**4. Wet Lab Experience:**
* **Question:** "Have you ever performed wet-lab experiments in a biology lab?"
* **Categories:** No, Yes
* **Trend:** The number of respondents with wet lab experience is slightly higher than those without.
* No: Approximately 6
* Yes: Approximately 2
### Key Observations
* In both Genomics Experience and Hypothesis Testing, the number of respondents identifying as "Expert" is the highest.
* The majority of respondents have attained a PhD.
* Most respondents have performed wet-lab experiments.
### Interpretation
The data suggests that the survey respondents are generally experienced in data analysis, statistical hypothesis testing, and wet-lab experiments. The high number of PhD holders indicates a highly educated group. The distribution of experience levels in genomics and hypothesis testing suggests a good mix of expertise, with a significant portion identifying as experts. The prevalence of wet-lab experience indicates a strong background in experimental biology.