\n
## Stacked Bar Charts: Experience and Education Levels
### Overview
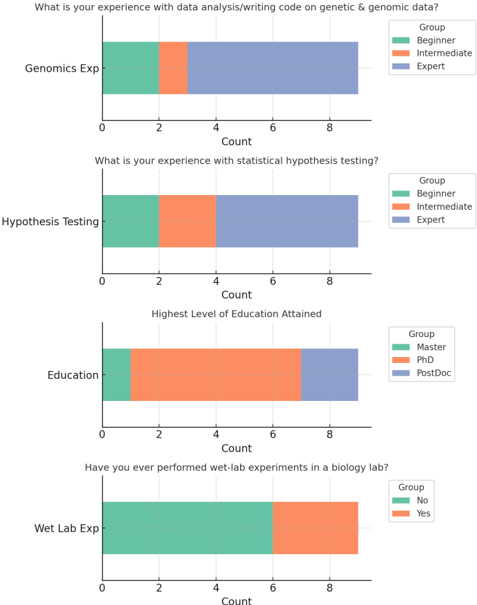
The image contains four stacked bar charts, each representing the distribution of responses to a survey question. The questions relate to experience with genomics data analysis, statistical hypothesis testing, highest level of education attained, and wet-lab biology experience. Each chart displays the count of respondents for different categories within each question.
### Components/Axes
Each chart shares the following components:
* **Title:** Located above each chart, indicating the survey question.
* **X-axis:** Labeled "Count", ranging from 0 to 8 (approximately).
* **Y-axis:** Implicitly represents the categories for each question.
* **Legend:** Positioned to the right of each chart, mapping colors to specific categories.
The specific categories for each chart are:
1. **Genomics Exp:** Beginner, Intermediate, Expert
2. **Hypothesis Testing:** Beginner, Intermediate, Expert
3. **Education:** Master, PhD, PostDoc
4. **Wet Lab Exp:** No, Yes
### Detailed Analysis or Content Details
**1. Genomics Experience:**
* **Beginner (Teal):** Approximately 2 count.
* **Intermediate (Orange):** Approximately 2 count.
* **Expert (Blue):** Approximately 4 count.
* *Trend:* The number of respondents decreases from Expert to Intermediate to Beginner.
**2. Hypothesis Testing Experience:**
* **Beginner (Teal):** Approximately 2 count.
* **Intermediate (Orange):** Approximately 3 count.
* **Expert (Blue):** Approximately 3 count.
* *Trend:* The number of respondents is relatively similar for Intermediate and Expert, and lower for Beginner.
**3. Highest Level of Education Attained:**
* **Master (Teal):** Approximately 2 count.
* **PhD (Orange):** Approximately 3 count.
* **PostDoc (Blue):** Approximately 3 count.
* *Trend:* The number of respondents is relatively similar for PhD and PostDoc, and lower for Master.
**4. Wet Lab Experience:**
* **No (Teal):** Approximately 2 count.
* **Yes (Orange):** Approximately 6 count.
* *Trend:* A significantly higher number of respondents have wet-lab experience compared to those who do not.
### Key Observations
* The "Expert" category consistently shows a higher count in the Genomics and Hypothesis Testing charts, suggesting a higher proportion of respondents with advanced experience in these areas.
* The PhD and PostDoc categories have similar counts in the Education chart, indicating a relatively even distribution of respondents with these levels of education.
* The Wet Lab Experience chart shows a clear majority of respondents having performed wet-lab experiments.
### Interpretation
The data suggests that the surveyed population generally possesses a good level of experience in genomics data analysis and statistical hypothesis testing, with a notable proportion identifying as "Experts." The distribution of educational attainment indicates a strong presence of individuals with doctoral degrees (PhD and PostDoc). The overwhelming majority of respondents have practical experience in biology labs, which is consistent with the focus on genomics and hypothesis testing.
The relatively low counts for the "Beginner" categories in the experience charts, combined with the high counts for "Expert," could indicate a self-selection bias in the survey respondents – individuals with more experience may be more likely to participate. The difference in counts between "Yes" and "No" in the Wet Lab Experience chart suggests that hands-on laboratory work is a common aspect of the respondents' backgrounds.
The charts provide a snapshot of the skills and experience levels within the surveyed population, which could be valuable for understanding the capabilities and interests of this group.