## Stacked Bar Charts: Survey Responses on Researcher Experience and Background
### Overview
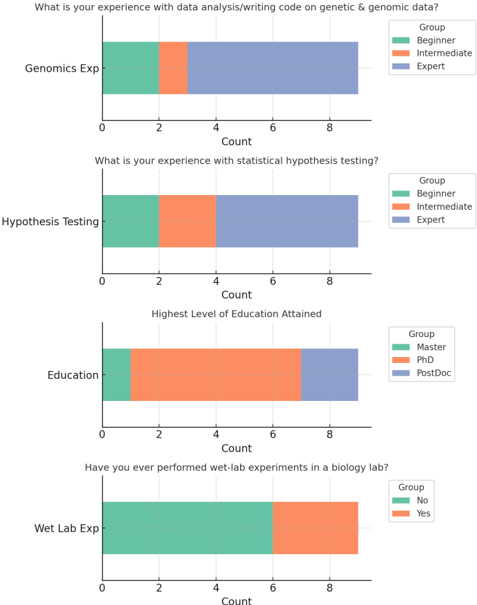
The image displays four horizontal stacked bar charts, each visualizing responses to a different survey question. The charts share a common structure: a question at the top, a categorical label on the y-axis, a "Count" scale on the x-axis (ranging from 0 to 8, with the final bar extending slightly beyond), and a legend on the right defining the color-coded groups within each bar. The overall theme is the demographic and experiential profile of a group of researchers.
### Components/Axes
* **Chart 1 (Top):**
* **Question:** "What is your experience with data analysis/writing code on genetic & genomic data?"
* **Y-axis Label:** "Genomics Exp"
* **X-axis Label:** "Count"
* **Legend (Right Side):** Group - Beginner (Green), Intermediate (Orange), Expert (Blue)
* **Chart 2 (Second from Top):**
* **Question:** "What is your experience with statistical hypothesis testing?"
* **Y-axis Label:** "Hypothesis Testing"
* **X-axis Label:** "Count"
* **Legend (Right Side):** Group - Beginner (Green), Intermediate (Orange), Expert (Blue)
* **Chart 3 (Third from Top):**
* **Question:** "Highest Level of Education Attained"
* **Y-axis Label:** "Education"
* **X-axis Label:** "Count"
* **Legend (Right Side):** Group - Master (Green), PhD (Orange), PostDoc (Blue)
* **Chart 4 (Bottom):**
* **Question:** "Have you ever performed wet-lab experiments in a biology lab?"
* **Y-axis Label:** "Wet Lab Exp"
* **X-axis Label:** "Count"
* **Legend (Right Side):** Group - No (Green), Yes (Orange)
### Detailed Analysis
**Chart 1: Genomics Experience**
* **Trend:** The "Expert" segment is the largest, followed by "Beginner," with "Intermediate" being the smallest.
* **Data Points (Approximate):**
* Beginner (Green): 2
* Intermediate (Orange): 1 (from count 2 to 3)
* Expert (Blue): 6 (from count 3 to 9)
* **Total Count:** ~9
**Chart 2: Hypothesis Testing Experience**
* **Trend:** Similar to Chart 1, "Expert" is the largest segment, but the "Intermediate" segment is larger here than in the genomics chart.
* **Data Points (Approximate):**
* Beginner (Green): 2
* Intermediate (Orange): 2 (from count 2 to 4)
* Expert (Blue): 5 (from count 4 to 9)
* **Total Count:** ~9
**Chart 3: Education Level**
* **Trend:** The "PhD" segment is overwhelmingly the largest, with "PostDoc" and "Master" being much smaller and roughly equal.
* **Data Points (Approximate):**
* Master (Green): 1
* PhD (Orange): 6 (from count 1 to 7)
* PostDoc (Blue): 2 (from count 7 to 9)
* **Total Count:** ~9
**Chart 4: Wet-Lab Experience**
* **Trend:** The "Yes" segment is larger than the "No" segment.
* **Data Points (Approximate):**
* No (Green): 6
* Yes (Orange): 3 (from count 6 to 9)
* **Total Count:** ~9
### Key Observations
1. **Consistent Sample Size:** All four charts appear to represent the same group of approximately 9 respondents, as the total bar length is consistent.
2. **Expertise Dominance:** The surveyed group shows high self-reported expertise in both computational (genomics coding) and statistical (hypothesis testing) domains.
3. **Advanced Education:** The group is predominantly composed of individuals holding PhDs.
4. **Mixed Methodological Background:** While computationally and statistically expert, the group is split on hands-on wet-lab experience, with a majority (approx. 67%) having performed such experiments.
5. **Legend Consistency:** The color scheme is consistent for the first two charts (Green=Beginner, Orange=Intermediate, Blue=Expert) but changes meaning for the last two charts (Green=Master/No, Orange=PhD/Yes, Blue=PostDoc). This requires careful reading of each chart's specific legend.
### Interpretation
The data paints a profile of a highly specialized research cohort. The respondents are likely early-to-mid-career principal investigators or senior postdoctoral researchers, given the high prevalence of PhDs and expert-level computational skills. The strong showing in both genomics coding and statistical hypothesis testing suggests a group engaged in quantitative, data-intensive biological research, such as bioinformatics, computational biology, or systems biology.
The split in wet-lab experience is notable. It indicates that while many in this group have a foundation in experimental biology, a significant portion (approx. 33%) may operate primarily in a computational or theoretical role. This could reflect the modern trend of specialization within biological sciences, where deep expertise in either wet-lab or dry-lab methods is common. The near-universal advanced education level underscores the high barrier to entry for this type of interdisciplinary research. The charts effectively communicate that this is not a group of novices, but rather a collection of experienced, highly trained specialists.