## Diagram: State Transition Diagram for RTBS
### Overview
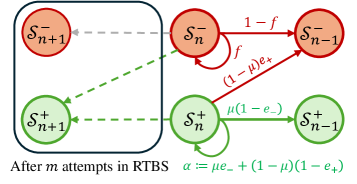
The image presents a state transition diagram illustrating the behavior of a system, likely related to a retry-based backoff scheme (RTBS). The diagram shows transitions between states denoted as S+ and S-, with subscripts indicating a numerical index. The transitions are labeled with probabilities or rates, representing the likelihood of moving from one state to another. The diagram is divided into two regions: one representing the state after 'm' attempts in RTBS, and the other showing the transitions between states.
### Components/Axes
* **States:**
* S+ (Green circles): Represents a "positive" state.
* S- (Red circles): Represents a "negative" state.
* Subscripts (n+1, n, n-1): Indicate the state's index or position in a sequence.
* **Transitions:** Arrows connecting the states, labeled with probabilities or rates.
* **Parameters:**
* f: Probability of a transition from S-n to S-n.
* μ: A parameter related to the transition rates.
* e+: A parameter related to the transition rates.
* e-: A parameter related to the transition rates.
* **Equation:** α := με- + (1 - μ)(1 - e+)
* **Region:** States S+n+1 and S-n+1 are enclosed in a rounded rectangle, labeled "After m attempts in RTBS".
### Detailed Analysis
* **S- States (Red):**
* S-n transitions to S-n-1 with probability (1-f).
* S-n transitions to S+n with probability f.
* S-n+1 transitions to S-n (dashed grey arrow).
* **S+ States (Green):**
* S+n transitions to S+n-1 with rate μ(1 - e-).
* S+n transitions to S-n with rate (1 - μ)e+.
* S+n+1 transitions to S+n (dashed green arrow).
* **Equation:** The equation α := με- + (1 - μ)(1 - e+) is given, likely representing a key parameter or probability related to the system's behavior.
### Key Observations
* The diagram shows transitions between "positive" and "negative" states, suggesting a system that can recover from failures or errors.
* The parameters f, μ, e+, and e- control the transition rates between the states.
* The equation for α likely represents a crucial aspect of the system's dynamics.
### Interpretation
The state transition diagram models a system that undergoes transitions between positive (S+) and negative (S-) states. The transitions are governed by probabilities and rates, which depend on the parameters f, μ, e+, and e-. The equation for α likely represents a key performance metric or probability related to the system's behavior. The diagram is likely used to analyze the system's stability, convergence, or performance under different conditions. The "After m attempts in RTBS" region suggests that the system involves a retry mechanism, where the system attempts to recover from failures by retrying the operation.