## Diagram: State Transition System with Probabilistic Paths
### Overview
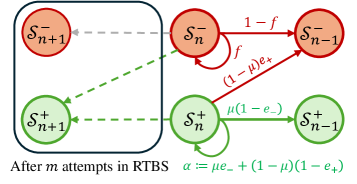
The diagram illustrates a probabilistic state transition system with two parallel pathways (red and green nodes) representing negative (S⁻) and positive (S⁺) states. Arrows denote transitions between states with associated probabilities, and a final equation defines an aggregate error rate (α). The system appears to model iterative attempts (m) in a process labeled "RTBS."
---
### Components/Axes
1. **Nodes**:
- **Red Nodes (S⁻)**:
- S⁻ₙ₊₁ (top-left)
- S⁻ₙ (center)
- S⁻ₙ₋₁ (top-right)
- **Green Nodes (S⁺)**:
- S⁺ₙ₊₁ (bottom-left)
- S⁺ₙ (center)
- S⁺ₙ₋₁ (bottom-right)
- Arrows connect nodes with directional probabilities (e.g., "1-f," "f," "μ(1-e_-)").
2. **Arrows/Transitions**:
- **Red Pathway**:
- S⁻ₙ → S⁻ₙ₋₁: Probability = 1 - f
- S⁻ₙ → S⁻ₙ₊₁: Probability = f (self-loop)
- **Green Pathway**:
- S⁺ₙ → S⁺ₙ₋₁: Probability = μ(1 - e_-)
- S⁺ₙ → S⁺ₙ₊₁: Probability = α (self-loop)
- **Cross-Path Arrows**:
- S⁻ₙ → S⁺ₙ: Probability = (1 - μ)e_+
- S⁺ₙ → S⁻ₙ: Probability = (1 - μ)(1 - e_+)
3. **Equation**:
- α := μe_- + (1 - μ)(1 - e_+)
- Positioned at the bottom-right, defining the aggregate error rate.
4. **Annotations**:
- "After m attempts in RTBS" (bottom-left corner).
---
### Detailed Analysis
- **Red Pathway (S⁻)**:
- Transitions between S⁻ states are governed by a Bernoulli process with parameter f (failure rate).
- Self-loop at S⁻ₙ implies a probability f of remaining in the same state.
- Transition to S⁻ₙ₋₁ occurs with probability 1 - f.
- **Green Pathway (S⁺)**:
- Transitions depend on μ (a weighting factor) and e_- (error rate for negative outcomes).
- Self-loop at S⁺ₙ has probability α, derived from the equation.
- Transition to S⁺ₙ₋₁ occurs with probability μ(1 - e_-).
- **Cross-Path Dynamics**:
- Red-to-green transitions (S⁻ₙ → S⁺ₙ) occur with probability (1 - μ)e_+.
- Green-to-red transitions (S⁺ₙ → S⁻ₙ) occur with probability (1 - μ)(1 - e_+).
---
### Key Observations
1. **Symmetry**: Red and green pathways mirror each other in structure but differ in transition probabilities.
2. **Error Aggregation**: The equation for α combines error terms from both pathways, suggesting α represents a system-wide error metric.
3. **Self-Loops**: Both pathways include self-loops, indicating the possibility of stalling in a state.
4. **Parameter Dependencies**: μ and e_± govern cross-path transitions, while f and e_- control intra-path transitions.
---
### Interpretation
This diagram models a **probabilistic state machine** with two competing pathways (S⁻ and S⁺). The transitions reflect:
- **Failure/Success Dynamics**: The red pathway (S⁻) emphasizes failure rates (f), while the green pathway (S⁺) focuses on error mitigation (e_-).
- **Error Propagation**: The equation for α quantifies the overall error rate, blending errors from both pathways weighted by μ.
- **Iterative Process**: The "m attempts" annotation suggests the system evolves over repeated trials, with states shifting based on probabilistic rules.
The model could represent scenarios like:
- **Machine Learning**: Classifying outcomes (S⁻/S⁺) with error correction.
- **Quality Control**: Tracking defects (S⁻) and rework (S⁺) in manufacturing.
- **Decision Trees**: Modeling choices with probabilistic outcomes.
Notably, the cross-path transitions (e.g., S⁻ₙ → S⁺ₙ) imply a feedback mechanism where errors in one pathway influence the other, highlighting interdependencies in the system.