## Diagram: Neural Network Architectures & Asymptotic Behavior
### Overview
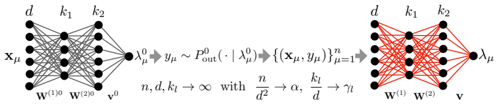
The image presents two diagrams illustrating neural network architectures alongside a mathematical expression describing their asymptotic behavior as the network size increases. The left diagram depicts a feedforward neural network, while the right diagram shows a different network structure. The central text block provides a mathematical relationship between network parameters and their limits.
### Components/Axes
The diagrams do not have traditional axes. Instead, they represent network layers with nodes (black circles) and connections (lines). The diagrams are labeled with variables representing input, weights, and output.
* **Left Diagram Labels:**
* `xµ`: Input layer.
* `d`: Number of input features.
* `k1`, `k2`: Number of nodes in hidden layers.
* `w(0)`: Weights connecting the input layer to the first hidden layer.
* `w(20)`: Weights connecting the first hidden layer to the second hidden layer.
* `v(0)`: Weights connecting the second hidden layer to the output layer.
* `λµ0`: Output of the first hidden layer.
* `λµ`: Output of the second hidden layer.
* **Right Diagram Labels:**
* `d`: Number of input features.
* `k1`, `k2`: Number of nodes in hidden layers.
* `w(0)`: Weights connecting the input layer to the first hidden layer.
* `w(2)`: Weights connecting the first hidden layer to the output layer.
* `λµ`: Output layer.
* `v`: Output.
* **Central Text Block:**
* `yµ0 ≈ Pout(·|λµ)`
* `{(xµ, yµ)n}fµ=1→1`
* `n, d, k1 → ∞ with n/d² → α, k1/d → η`
### Detailed Analysis or Content Details
**Left Diagram:**
The left diagram shows a feedforward neural network with an input layer (`xµ`) connected to two hidden layers (`λµ0`, `λµ`) and finally to an output layer (`λµ`). The connections between layers are represented by lines, indicating weighted connections (`w(0)`, `w(20)`, `v(0)`). The number of nodes in each layer is denoted by `d`, `k1`, and `k2`.
**Right Diagram:**
The right diagram depicts a different network structure. The input layer (`d`) is fully connected to a hidden layer (`k1`), and this hidden layer is fully connected to the output layer (`λµ`). The weights connecting these layers are denoted by `w(0)` and `w(2)`. The output is represented by `v`.
**Central Text Block:**
The text block presents a mathematical relationship.
* `yµ0 ≈ Pout(·|λµ)`: This equation suggests that the output of the first hidden layer (`yµ0`) is approximately equal to the probability distribution `Pout` conditioned on `λµ`.
* `{(xµ, yµ)n}fµ=1→1`: This notation indicates a sequence of data points `(xµ, yµ)` with `n` samples, where `fµ=1` suggests a limit or convergence.
* `n, d, k1 → ∞ with n/d² → α, k1/d → η`: This statement describes the asymptotic behavior of the network as the number of samples (`n`), input features (`d`), and nodes in the first hidden layer (`k1`) approach infinity. The ratios `n/d²` and `k1/d` converge to constants `α` and `η`, respectively.
### Key Observations
* The diagrams illustrate different neural network architectures. The left diagram shows a deeper network with multiple hidden layers, while the right diagram shows a shallower network.
* The mathematical expression describes the behavior of these networks as their size increases. The convergence of `n/d²` to `α` and `k1/d` to `η` suggests that the network's performance depends on the relationship between the number of samples, input features, and hidden layer nodes.
* The notation used in the mathematical expression is standard in the field of neural networks and statistical learning.
### Interpretation
The image demonstrates the relationship between neural network architecture, network size, and asymptotic behavior. The diagrams visually represent the flow of information through the network, while the mathematical expression provides a formal description of how the network's performance changes as its size increases. The convergence of the ratios `n/d²` and `k1/d` suggests that there is an optimal balance between the number of samples, input features, and hidden layer nodes for achieving good performance. The notation `Pout(·|λµ)` suggests a probabilistic interpretation of the network's output, where the network is learning to estimate a probability distribution. The diagrams and the mathematical expression together provide a comprehensive understanding of the fundamental principles underlying neural network design and training.