## Bar Chart: Gain vs Best Baseline (%)
### Overview
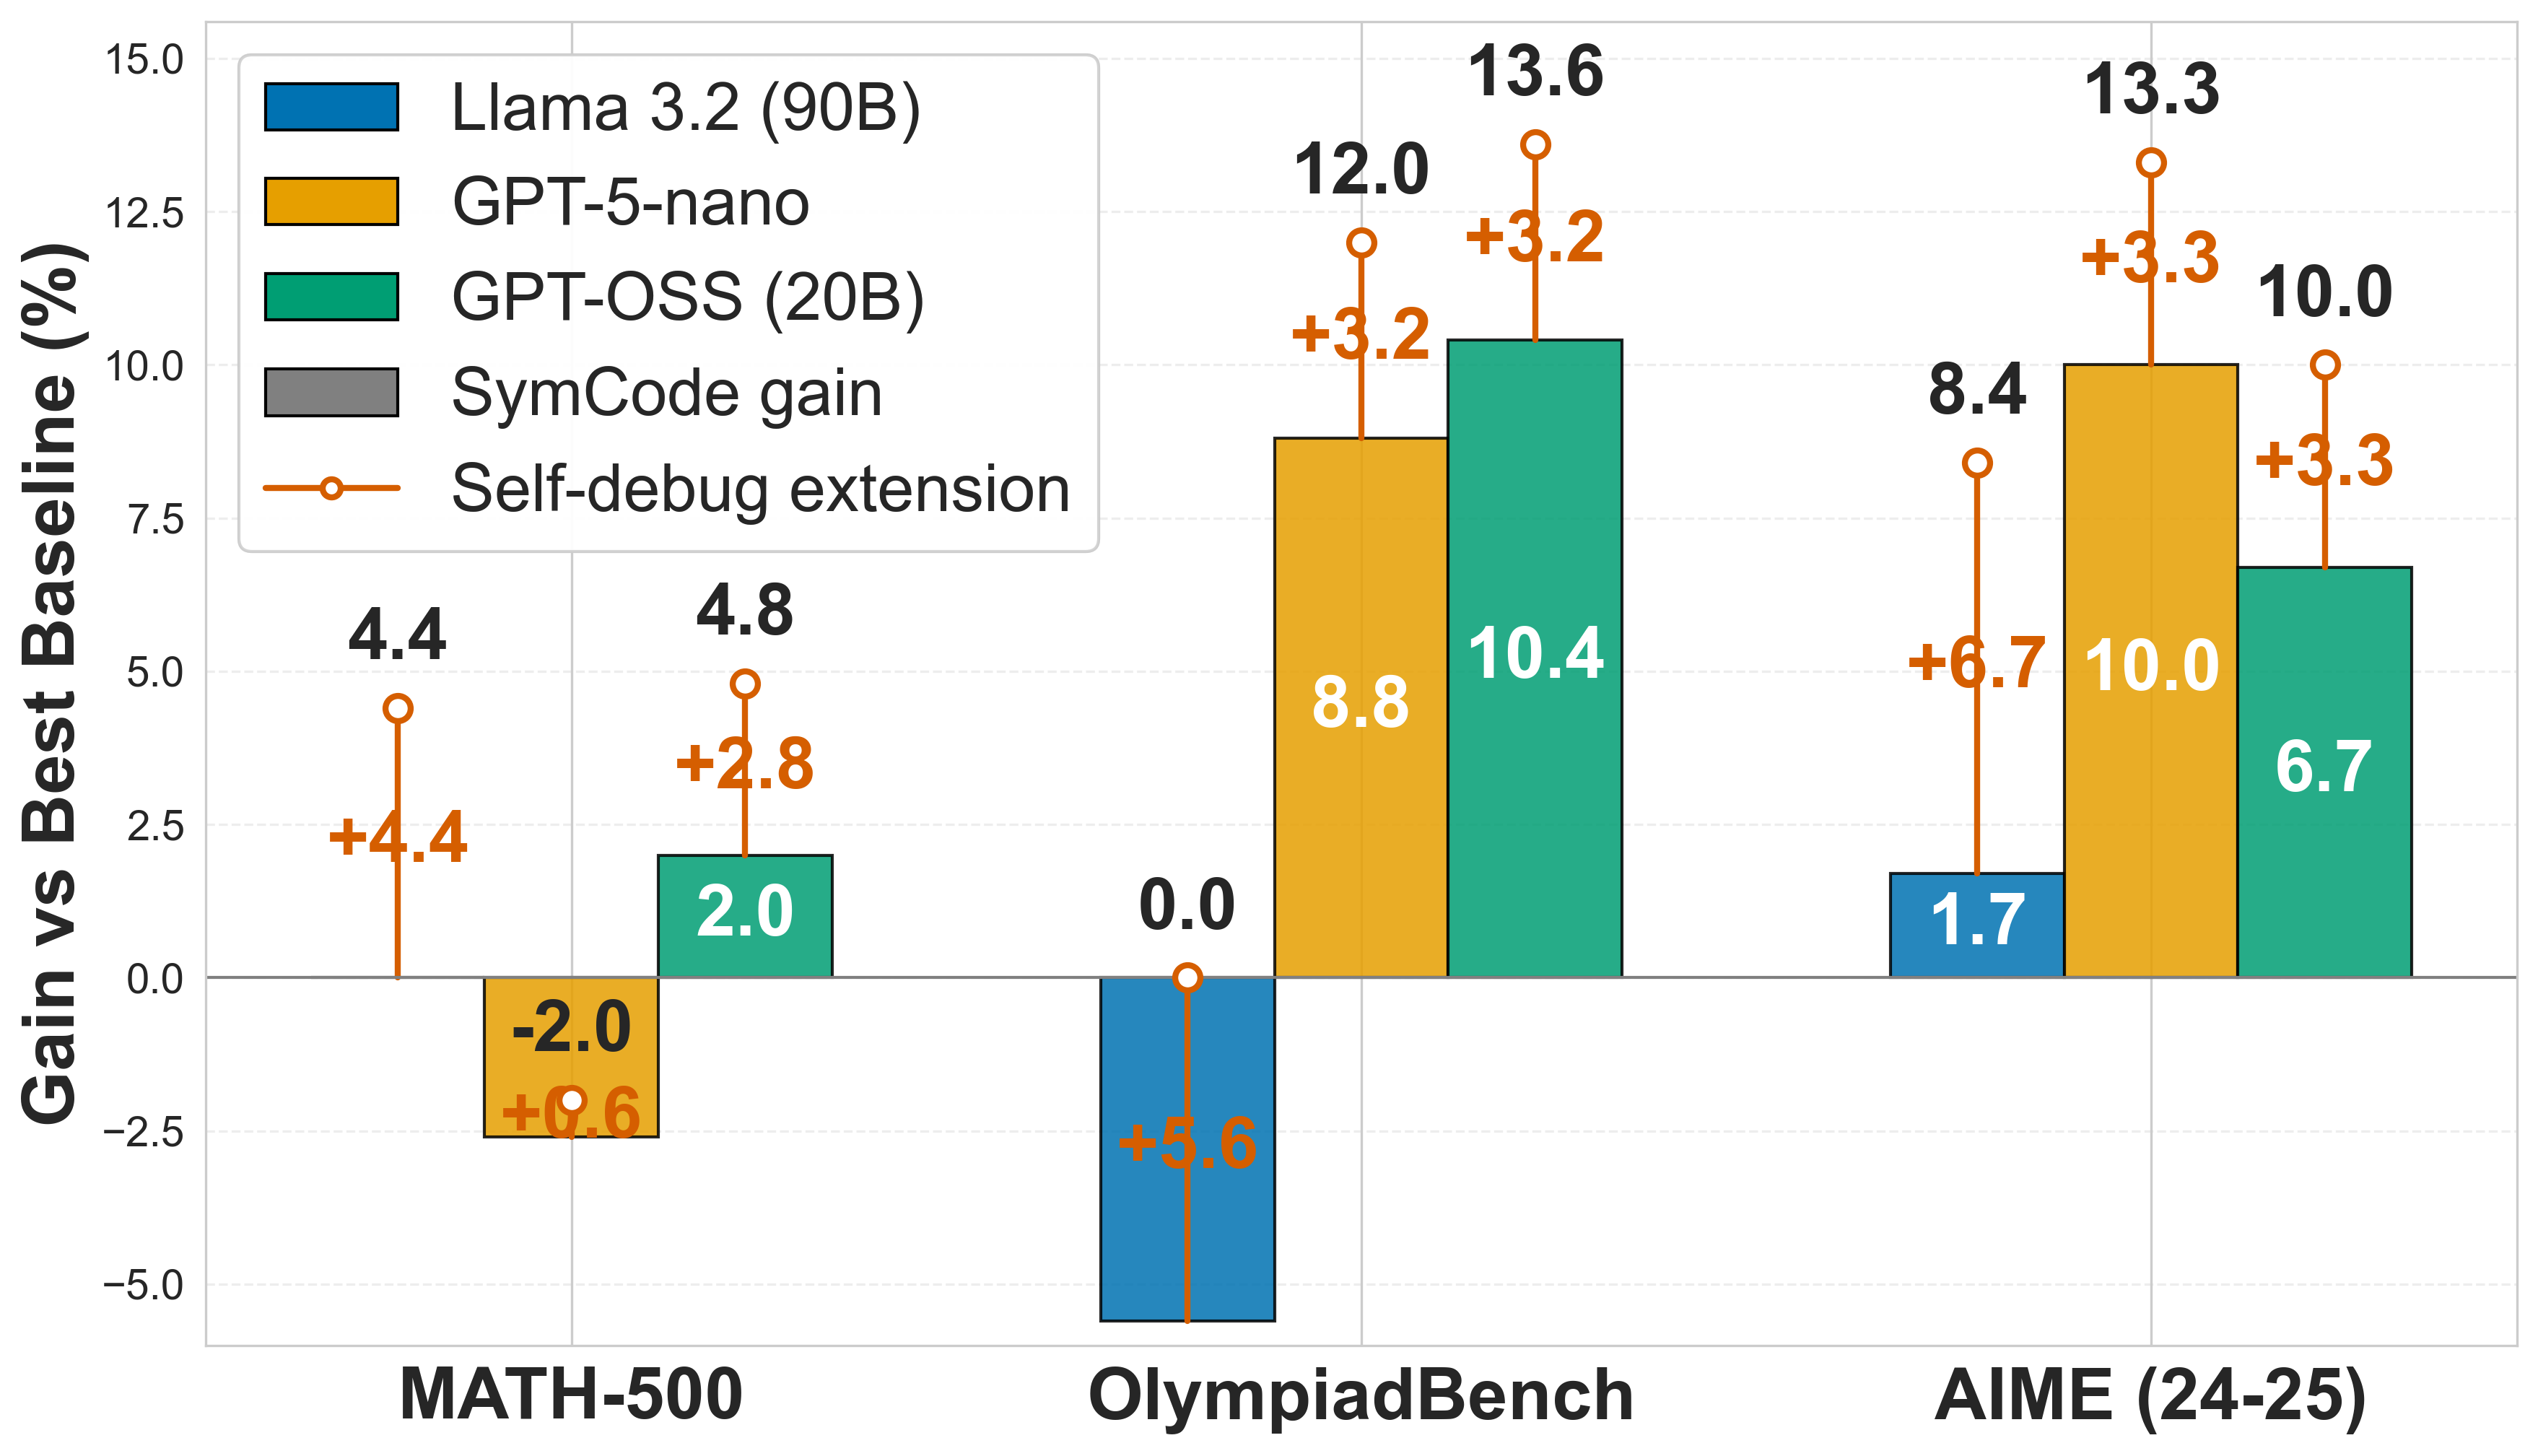
This image is a grouped bar chart illustrating the performance gains of three different AI models (Llama 3.2 (90B), GPT-5-nano, and GPT-OSS (20B)) across three distinct benchmarks: MATH-500, OlympiadBench, and AIME (24-25). The chart also displays the impact of a "Self-debug extension" using orange lines and circles, which indicate the total performance after the extension is applied.
### Components/Axes
* **Y-Axis**: "Gain vs Best Baseline (%)". The scale ranges from -5.0 to 15.0 in increments of 2.5.
* **X-Axis**: Three categories: "MATH-500", "OlympiadBench", and "AIME (24-25)".
* **Legend (Top-Left)**:
* **Blue Rectangle**: Llama 3.2 (90B)
* **Yellow Rectangle**: GPT-5-nano
* **Green Rectangle**: GPT-OSS (20B)
* **Grey Rectangle**: SymCode gain (Note: This category appears in the legend but is not represented by any data bars in the chart).
* **Orange Line with Circle**: Self-debug extension
* **Data Representation**:
* **Bars**: Represent the baseline performance of the models.
* **Orange Lines/Circles**: Represent the performance after applying the "Self-debug extension".
* **Orange Text**: Indicates the numerical gain added by the "Self-debug extension".
* **Black Text (above circles)**: Indicates the total performance value after the extension.
### Detailed Analysis
The following table reconstructs the data presented in the chart. Values are in percent (%).
| Benchmark | Model | Baseline Bar Value | Self-Debug Gain (Orange Text) | Total Value (Top Circle) |
| :--- | :--- | :--- | :--- | :--- |
| **MATH-500** | Llama 3.2 (90B) | N/A | +4.4 | 4.4 |
| | GPT-5-nano | -2.0 | +2.8 | 4.8 |
| | GPT-OSS (20B) | 2.0 | N/A | N/A |
| **OlympiadBench** | Llama 3.2 (90B) | -5.6 | +5.6 | 0.0 |
| | GPT-5-nano | 8.8 | +3.2 | 12.0 |
| | GPT-OSS (20B) | 10.4 | +3.2 | 13.6 |
| **AIME (24-25)** | Llama 3.2 (90B) | 1.7 | +6.7 | 8.4 |
| | GPT-5-nano | 10.0 | +3.3 | 13.3 |
| | GPT-OSS (20B) | 6.7 | +3.3 | 10.0 |
*Note: "N/A" indicates that no data point or bar is present for that specific combination.*
### Key Observations
* **Consistent Improvement**: The "Self-debug extension" consistently provides a positive gain across all models and benchmarks where it is applied.
* **Recovery from Negative Baselines**: In cases where the baseline performance is negative (e.g., Llama 3.2 on OlympiadBench at -5.6, GPT-5-nano on MATH-500 at -2.0), the extension significantly improves performance, bringing the result to 0.0 or higher.
* **Missing Data**:
* The "SymCode gain" listed in the legend has no corresponding data in the chart.
* Llama 3.2 (90B) has no baseline bar for MATH-500.
* GPT-OSS (20B) has no "Self-debug extension" data for MATH-500.
* **Arithmetic Discrepancy**: In the MATH-500 category for GPT-5-nano, the baseline is -2.0 and the gain is +2.8, which mathematically equals 0.8, yet the top circle is labeled 4.8. This suggests either a non-linear calculation or a potential labeling error in the source graphic.
### Interpretation
The data demonstrates that the "Self-debug extension" is a highly effective mechanism for improving model performance, particularly for models that underperform relative to the baseline (negative values). It acts as a "performance floor" raiser, effectively neutralizing negative baselines and providing a consistent boost (ranging from +2.8 to +6.7) to models that are already performing positively. The chart suggests that the extension is most impactful on the Llama 3.2 (90B) model, which sees the largest absolute gains (e.g., +6.7 on AIME). The absence of the "SymCode gain" suggests this chart may be a partial view of a larger dataset or a template where that specific metric was omitted.