## Bar Chart: Performance Gain vs Best Baseline with Self-Debug Extension
### Overview
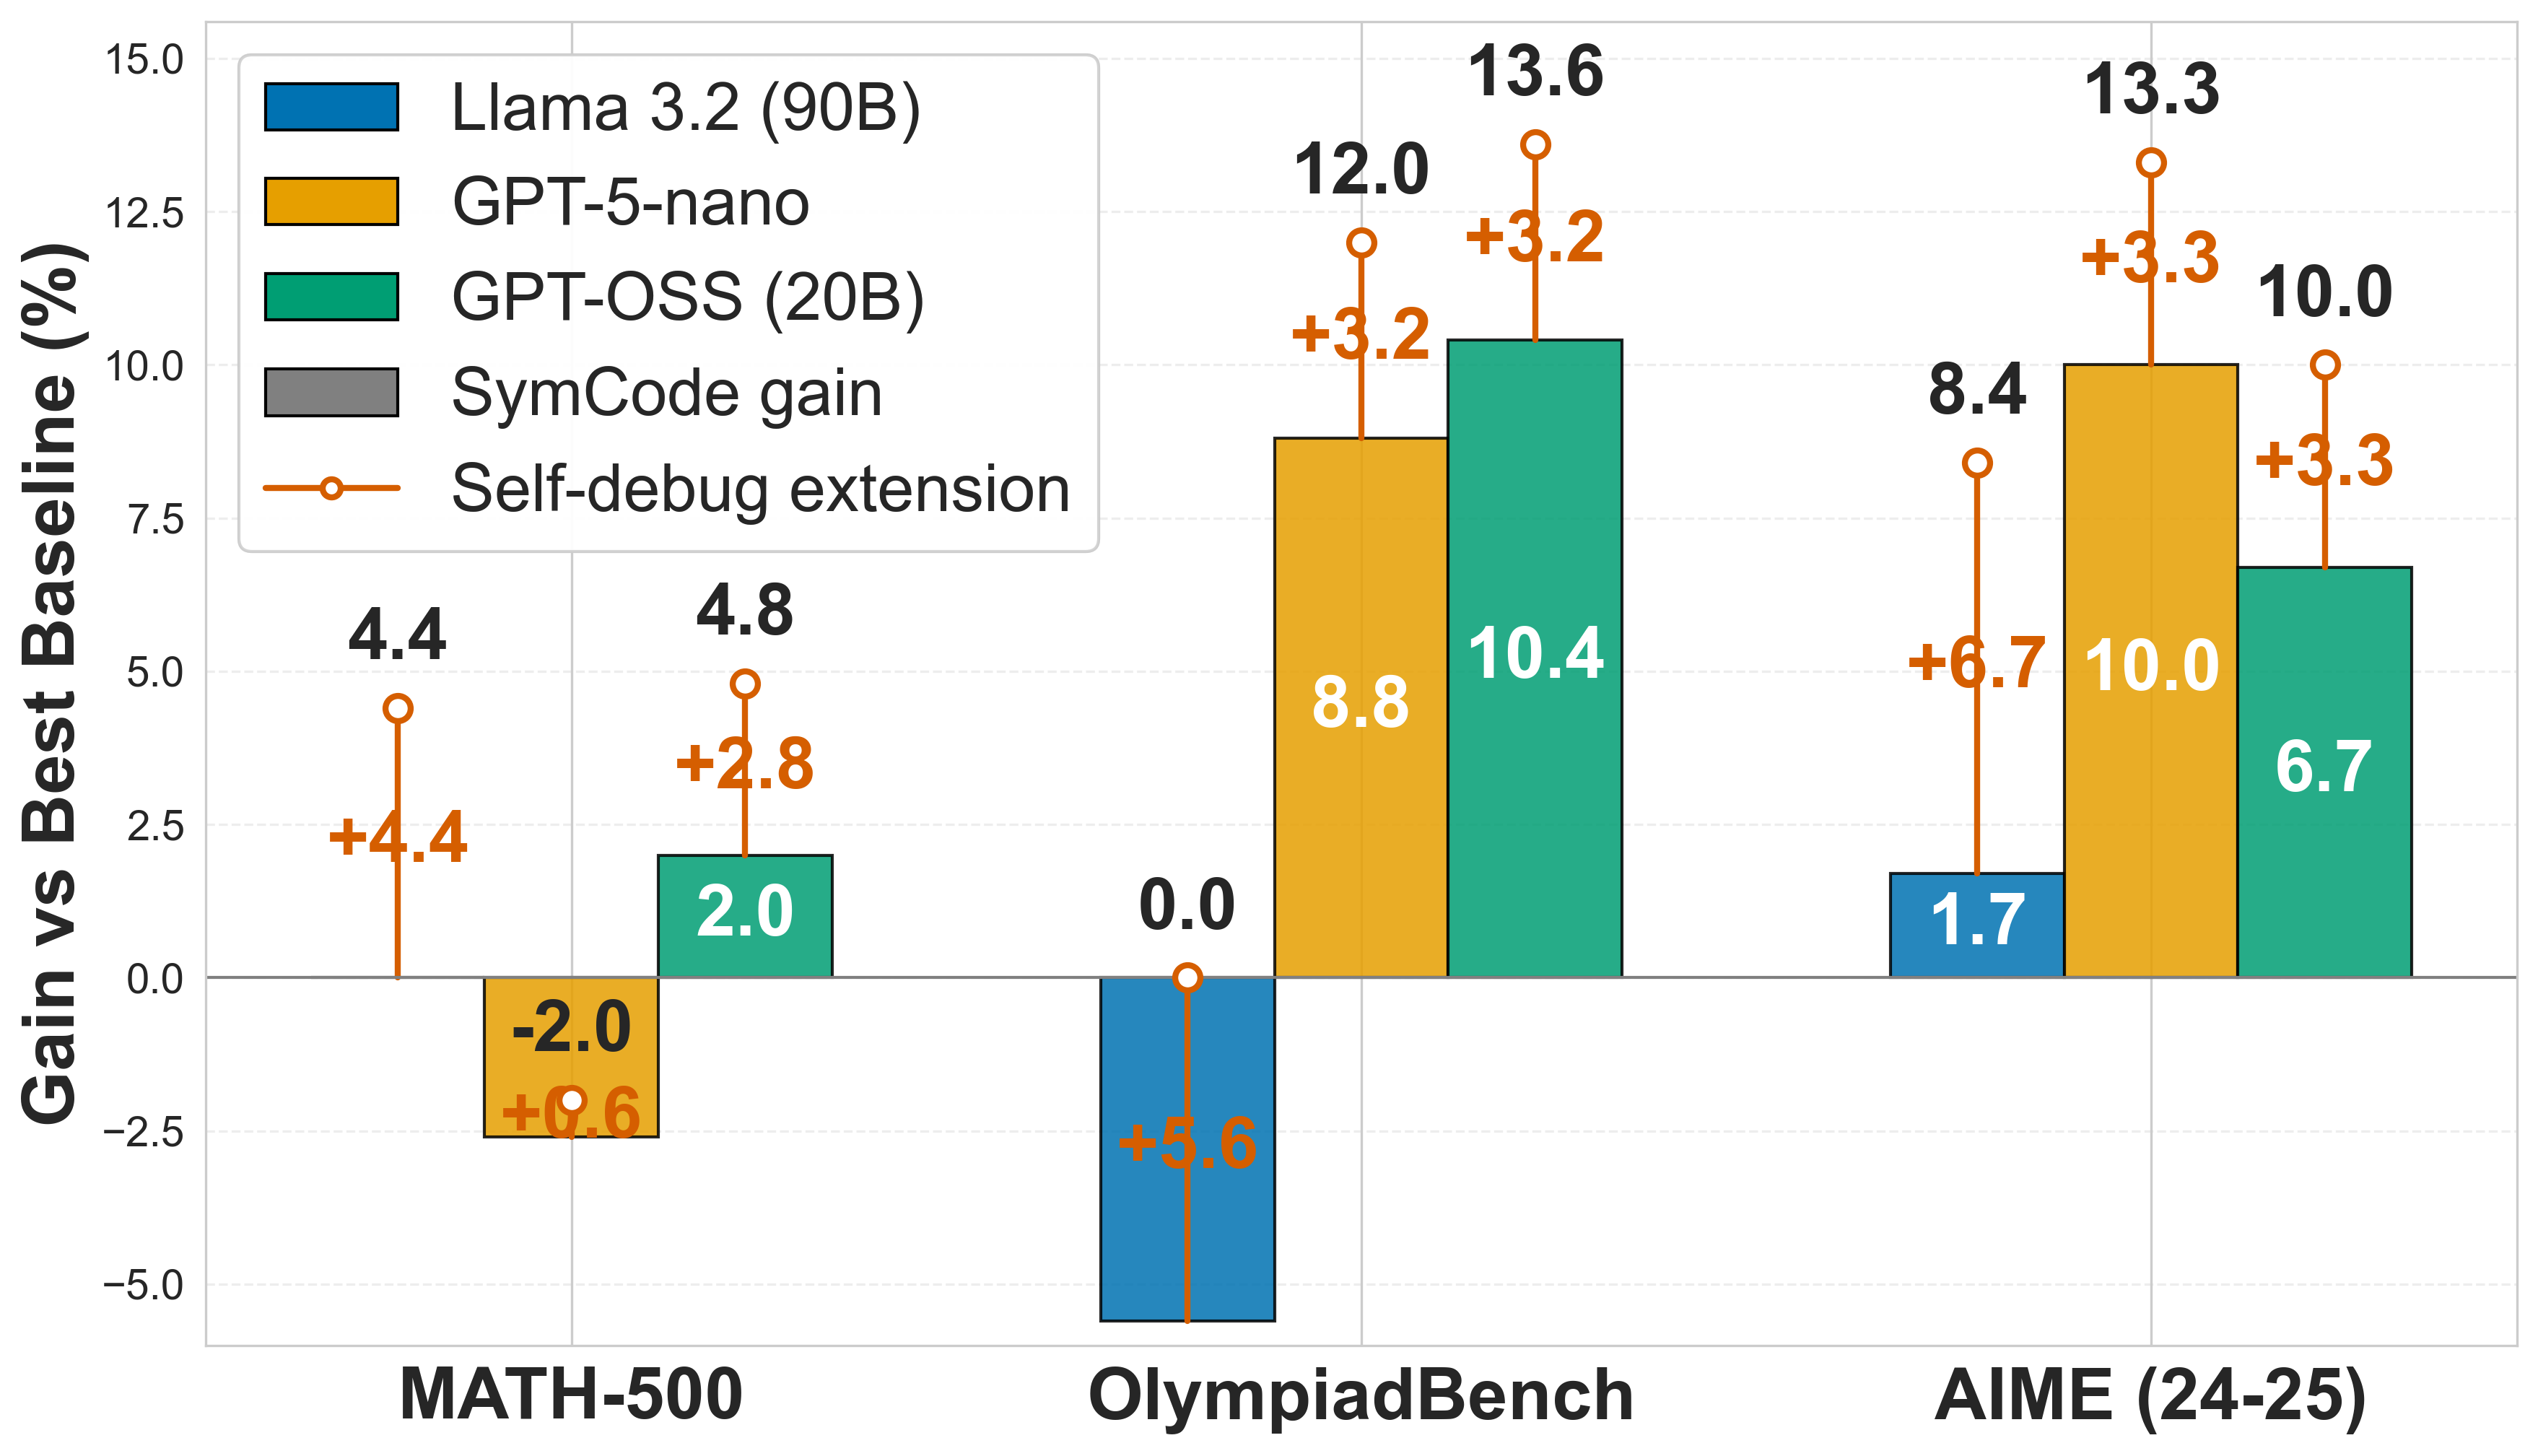
This image is a grouped bar chart demonstrating the performance gains of three different Large Language Models (LLMs) across three mathematical benchmarks. The chart illustrates two distinct metrics for each model: a base performance gain (attributed to "SymCode") and an additional performance boost provided by a "Self-debug extension."
### Components/Axes
**Spatial Layout & Isolation:**
* **Header/Title:** There is no explicit title text at the top of the image.
* **Y-Axis (Left):** Positioned vertically on the left.
* **Title:** "Gain vs Best Baseline (%)" (Rotated 90 degrees counter-clockwise).
* **Scale:** Ranges from `-5.0` at the bottom to `15.0` at the top, with increments of `2.5` (-5.0, -2.5, 0.0, 2.5, 5.0, 7.5, 10.0, 12.5, 15.0).
* **Markers:** A solid, dark horizontal line marks the `0.0` baseline. Faint, dashed light-grey horizontal grid lines extend across the chart at every 2.5 increment.
* **X-Axis (Bottom):** Positioned horizontally at the bottom.
* **Categories:** Three distinct benchmark groupings, labeled from left to right: "MATH-500", "OlympiadBench", and "AIME (24-25)".
* **Legend (Top-Left):** Enclosed in a white box with a thin grey border, positioned in the upper-left quadrant of the chart area. It contains five items:
1. **Blue Square:** Llama 3.2 (90B)
2. **Yellow/Orange Square:** GPT-5-nano
3. **Green Square:** GPT-OSS (20B)
4. **Grey Square:** SymCode gain (Note: Grey is not used in the data bars; this square acts as a generic key indicating that the solid colored bars represent the base "SymCode gain").
5. **Orange Line with Open Circle:** Self-debug extension (Indicates the vertical lines extending from the top of the solid bars).
### Detailed Analysis
**Visual Trend Verification:**
Across all categories, the solid bars (SymCode gain) fluctuate, with some extending positively above the 0.0 line and others extending negatively below it. However, the orange "Self-debug extension" lines *always* project upward from the end of the solid bar, indicating a strictly positive addition to the score.
**Data Extraction Table:**
*Note: The "Total Gain" is represented by black text above the orange circles. The "SymCode Gain" is represented by white text inside the colored bars (or inferred if missing). The "Self-Debug Gain" is represented by orange text next to the vertical lines.*
| Benchmark (X-Axis) | Model (Color) | SymCode Gain (Base Bar) | Self-Debug Gain (Orange Line) | Total Gain (Black Text) |
| :--- | :--- | :--- | :--- | :--- |
| **MATH-500** | Llama 3.2 (90B) (Blue) | 0.0* | +4.4 | 4.4 |
| | GPT-5-nano (Yellow) | -2.0 | +0.6 | N/A** |
| | GPT-OSS (20B) (Green) | 2.0 | +2.8 | 4.8 |
| **OlympiadBench** | Llama 3.2 (90B) (Blue) | -5.6*** | +5.6 | 0.0 |
| | GPT-5-nano (Yellow) | 8.8 | +3.2 | 12.0 |
| | GPT-OSS (20B) (Green) | 10.4 | +3.2 | 13.6 |
| **AIME (24-25)** | Llama 3.2 (90B) (Blue) | 1.7 | +6.7 | 8.4 |
| | GPT-5-nano (Yellow) | 10.0 | +3.3 | 13.3 |
| | GPT-OSS (20B) (Green) | 6.7 | +3.3 | 10.0 |
*Data Extraction Notes:*
* *\*MATH-500 / Llama 3.2:* There is no visible blue bar. The orange line originates exactly at the 0.0 axis line, implying a base gain of 0.0.
* *\*\*MATH-500 / GPT-5-nano:* This is the only data point lacking a black "Total Gain" number at the top of the circle. Mathematically (-2.0 + 0.6), the top of the circle rests at -1.4.
* *\*\*\*OlympiadBench / Llama 3.2:* There is no white text inside the downward-pointing blue bar. However, the orange text (+5.6) and the black total text (0.0) allow us to deduce the base bar value is -5.6. Visually, the bar extends just below the -5.0 gridline, confirming this.
### Key Observations
1. **Universal Improvement from Self-Debug:** In every single instance across all models and benchmarks, the "Self-debug extension" (orange line) provides a positive gain.
2. **Negative Base Performances:** The base "SymCode" method does not always beat the baseline. GPT-5-nano performs worse than the baseline on MATH-500 (-2.0%), and Llama 3.2 performs significantly worse on OlympiadBench (-5.6%).
3. **Highest Overall Performance:** The highest total gain achieved in the chart is 13.6% by GPT-OSS (20B) on the OlympiadBench benchmark.
4. **Llama 3.2 Reliance on Self-Debug:** Llama 3.2 (90B) shows weak base "SymCode" gains (0.0, -5.6, 1.7) but receives massive boosts from the self-debug extension (+4.4, +5.6, +6.7)—the largest self-debug boosts of any model on the chart.
### Interpretation
The data strongly suggests that the "Self-debug extension" is a highly effective, universally beneficial mechanism for improving LLM performance on mathematical reasoning tasks, regardless of the underlying model's initial capability.
Reading between the lines, the "SymCode" method alone is volatile. It yields strong positive results for GPT-5-nano and GPT-OSS on OlympiadBench and AIME, but actually degrades performance compared to the "Best Baseline" for certain models on specific tests (e.g., Llama on OlympiadBench).
However, the self-debug extension acts as a powerful corrective measure. For example, on OlympiadBench, Llama 3.2's base performance drops by 5.6%, but the self-debug mechanism perfectly recovers that loss (+5.6%), bringing the model back to baseline (0.0). Furthermore, Llama 3.2 seems to possess a high capacity for self-correction, as its orange self-debug gains are consistently the largest, compensating for its relatively poor base SymCode performance. Conversely, GPT-5-nano and GPT-OSS show stronger initial SymCode gains but receive slightly smaller, more uniform boosts (~+3.2 to +3.3) from self-debugging on the harder benchmarks.