\n
## Grouped Bar Chart: Model Performance Gains vs. Best Baseline
### Overview
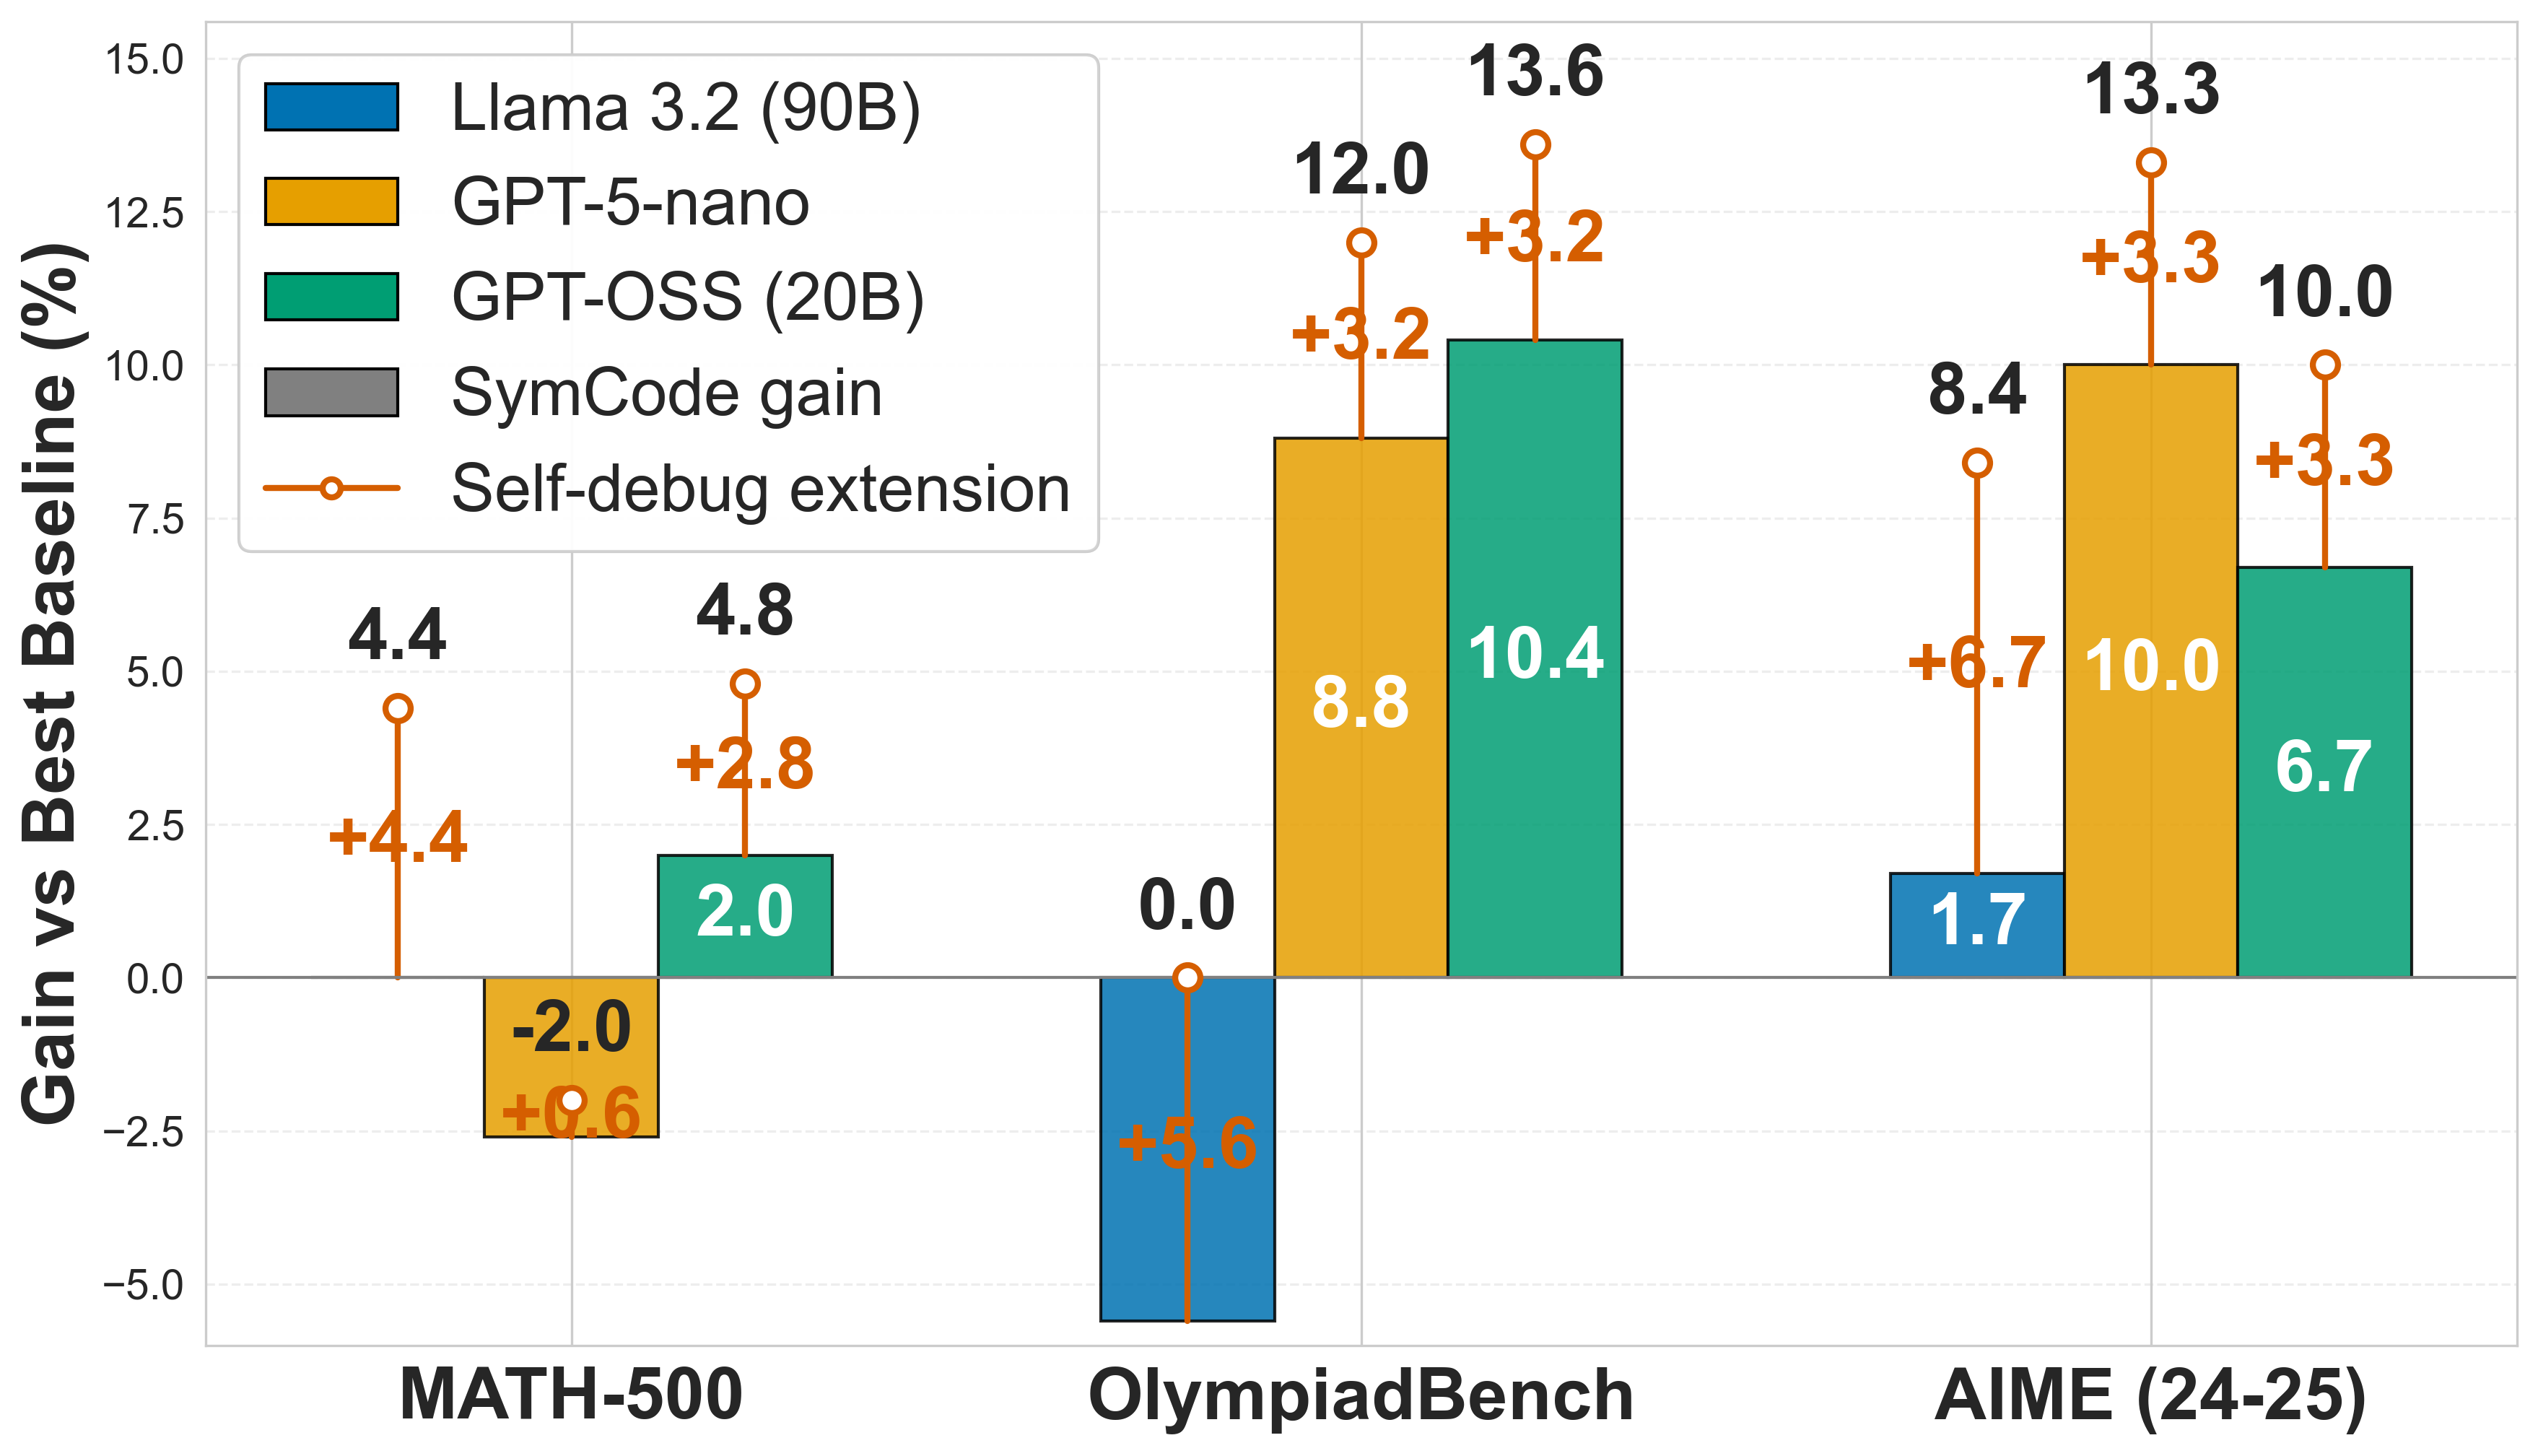
This image is a grouped bar chart comparing the performance gains (in percentage points) of three large language models across three mathematical benchmarks. The chart also visualizes the additional performance gain achieved by applying a "Self-debug extension" to each model. The y-axis represents the "Gain vs Best Baseline (%)", and the x-axis lists the three benchmark datasets.
### Components/Axes
* **Y-Axis:** Labeled "Gain vs Best Baseline (%)". The scale ranges from -5.0 to 15.0, with major gridlines at intervals of 2.5.
* **X-Axis:** Lists three benchmark categories:
1. MATH-500
2. OlympiadBench
3. AIME (24-25)
* **Legend (Top-Left):** Defines the visual encoding for the data series:
* **Blue Bar:** Llama 3.2 (90B)
* **Yellow Bar:** GPT-5-nano
* **Green Bar:** GPT-OSS (20B)
* **Gray Bar:** SymCode gain (Note: No gray bars are present in the chart data).
* **Orange Line with Circle Marker:** Self-debug extension. This represents the *additional* gain on top of the base model's performance (the bar height).
### Detailed Analysis
The chart presents data for three models across three benchmarks. The base performance gain is shown by the bar height. The orange line and marker indicate the total performance when the "Self-debug extension" is applied, with the orange number showing the *incremental* gain from the extension.
**1. MATH-500 Benchmark**
* **Llama 3.2 (90B):** Base gain = 4.4%. With Self-debug extension, total gain = 4.4% + 4.4% = **8.8%**.
* **GPT-5-nano:** Base gain = -2.0%. With Self-debug extension, total gain = -2.0% + 0.6% = **-1.4%**.
* **GPT-OSS (20B):** Base gain = 2.0%. With Self-debug extension, total gain = 2.0% + 2.8% = **4.8%**.
**2. OlympiadBench Benchmark**
* **Llama 3.2 (90B):** Base gain = 0.0%. With Self-debug extension, total gain = 0.0% + 5.6% = **5.6%**.
* **GPT-5-nano:** Base gain = 8.8%. With Self-debug extension, total gain = 8.8% + 3.2% = **12.0%**.
* **GPT-OSS (20B):** Base gain = 10.4%. With Self-debug extension, total gain = 10.4% + 3.2% = **13.6%**.
**3. AIME (24-25) Benchmark**
* **Llama 3.2 (90B):** Base gain = 1.7%. With Self-debug extension, total gain = 1.7% + 6.7% = **8.4%**.
* **GPT-5-nano:** Base gain = 10.0%. With Self-debug extension, total gain = 10.0% + 3.3% = **13.3%**.
* **GPT-OSS (20B):** Base gain = 6.7%. With Self-debug extension, total gain = 6.7% + 3.3% = **10.0%**.
### Key Observations
1. **Self-debug Extension Impact:** The "Self-debug extension" (orange) provides a positive performance boost for every model on every benchmark, with gains ranging from +0.6% to +6.7%.
2. **Model Performance Variability:** No single model is the top performer across all benchmarks.
* **GPT-OSS (20B)** has the highest base gain on OlympiadBench (10.4%) and the highest total gain on OlympiadBench (13.6%).
* **GPT-5-nano** has the highest base gain on AIME (10.0%) and the highest total gain on AIME (13.3%).
* **Llama 3.2 (90B)** shows the most dramatic relative improvement from the Self-debug extension, particularly on OlympiadBench (+5.6%) and AIME (+6.7%).
3. **Negative Baseline:** GPT-5-nano shows a negative gain (-2.0%) on the MATH-500 benchmark, indicating it performed worse than the "Best Baseline" for that specific task.
4. **SymCode Gain:** The legend includes "SymCode gain" (gray), but no corresponding gray bars are visible in the chart, suggesting this data series may be absent or have zero values for these benchmarks.
### Interpretation
This chart demonstrates the effectiveness of a "Self-debug extension" as a performance-enhancing technique for large language models on mathematical reasoning tasks. The key takeaway is that the extension provides consistent, sometimes substantial, improvements regardless of the base model's initial performance.
The data suggests that the utility of both the base models and the debug extension is highly task-dependent. For instance, while GPT-5-nano struggles on MATH-500, it excels on AIME. Conversely, Llama 3.2 benefits enormously from the debug extension on the more complex OlympiadBench and AIME datasets, implying the extension may be particularly valuable for models tackling harder problems where self-correction is crucial.
The absence of "SymCode gain" data is a notable gap. If it represents an alternative technique, its lack of results here prevents comparison. Overall, the chart makes a case for the "Self-debug extension" as a broadly applicable method to boost model performance in mathematical domains, with the magnitude of benefit varying by model and task difficulty.