# Technical Document Extraction: Performance Gain Analysis Chart
## Chart Overview
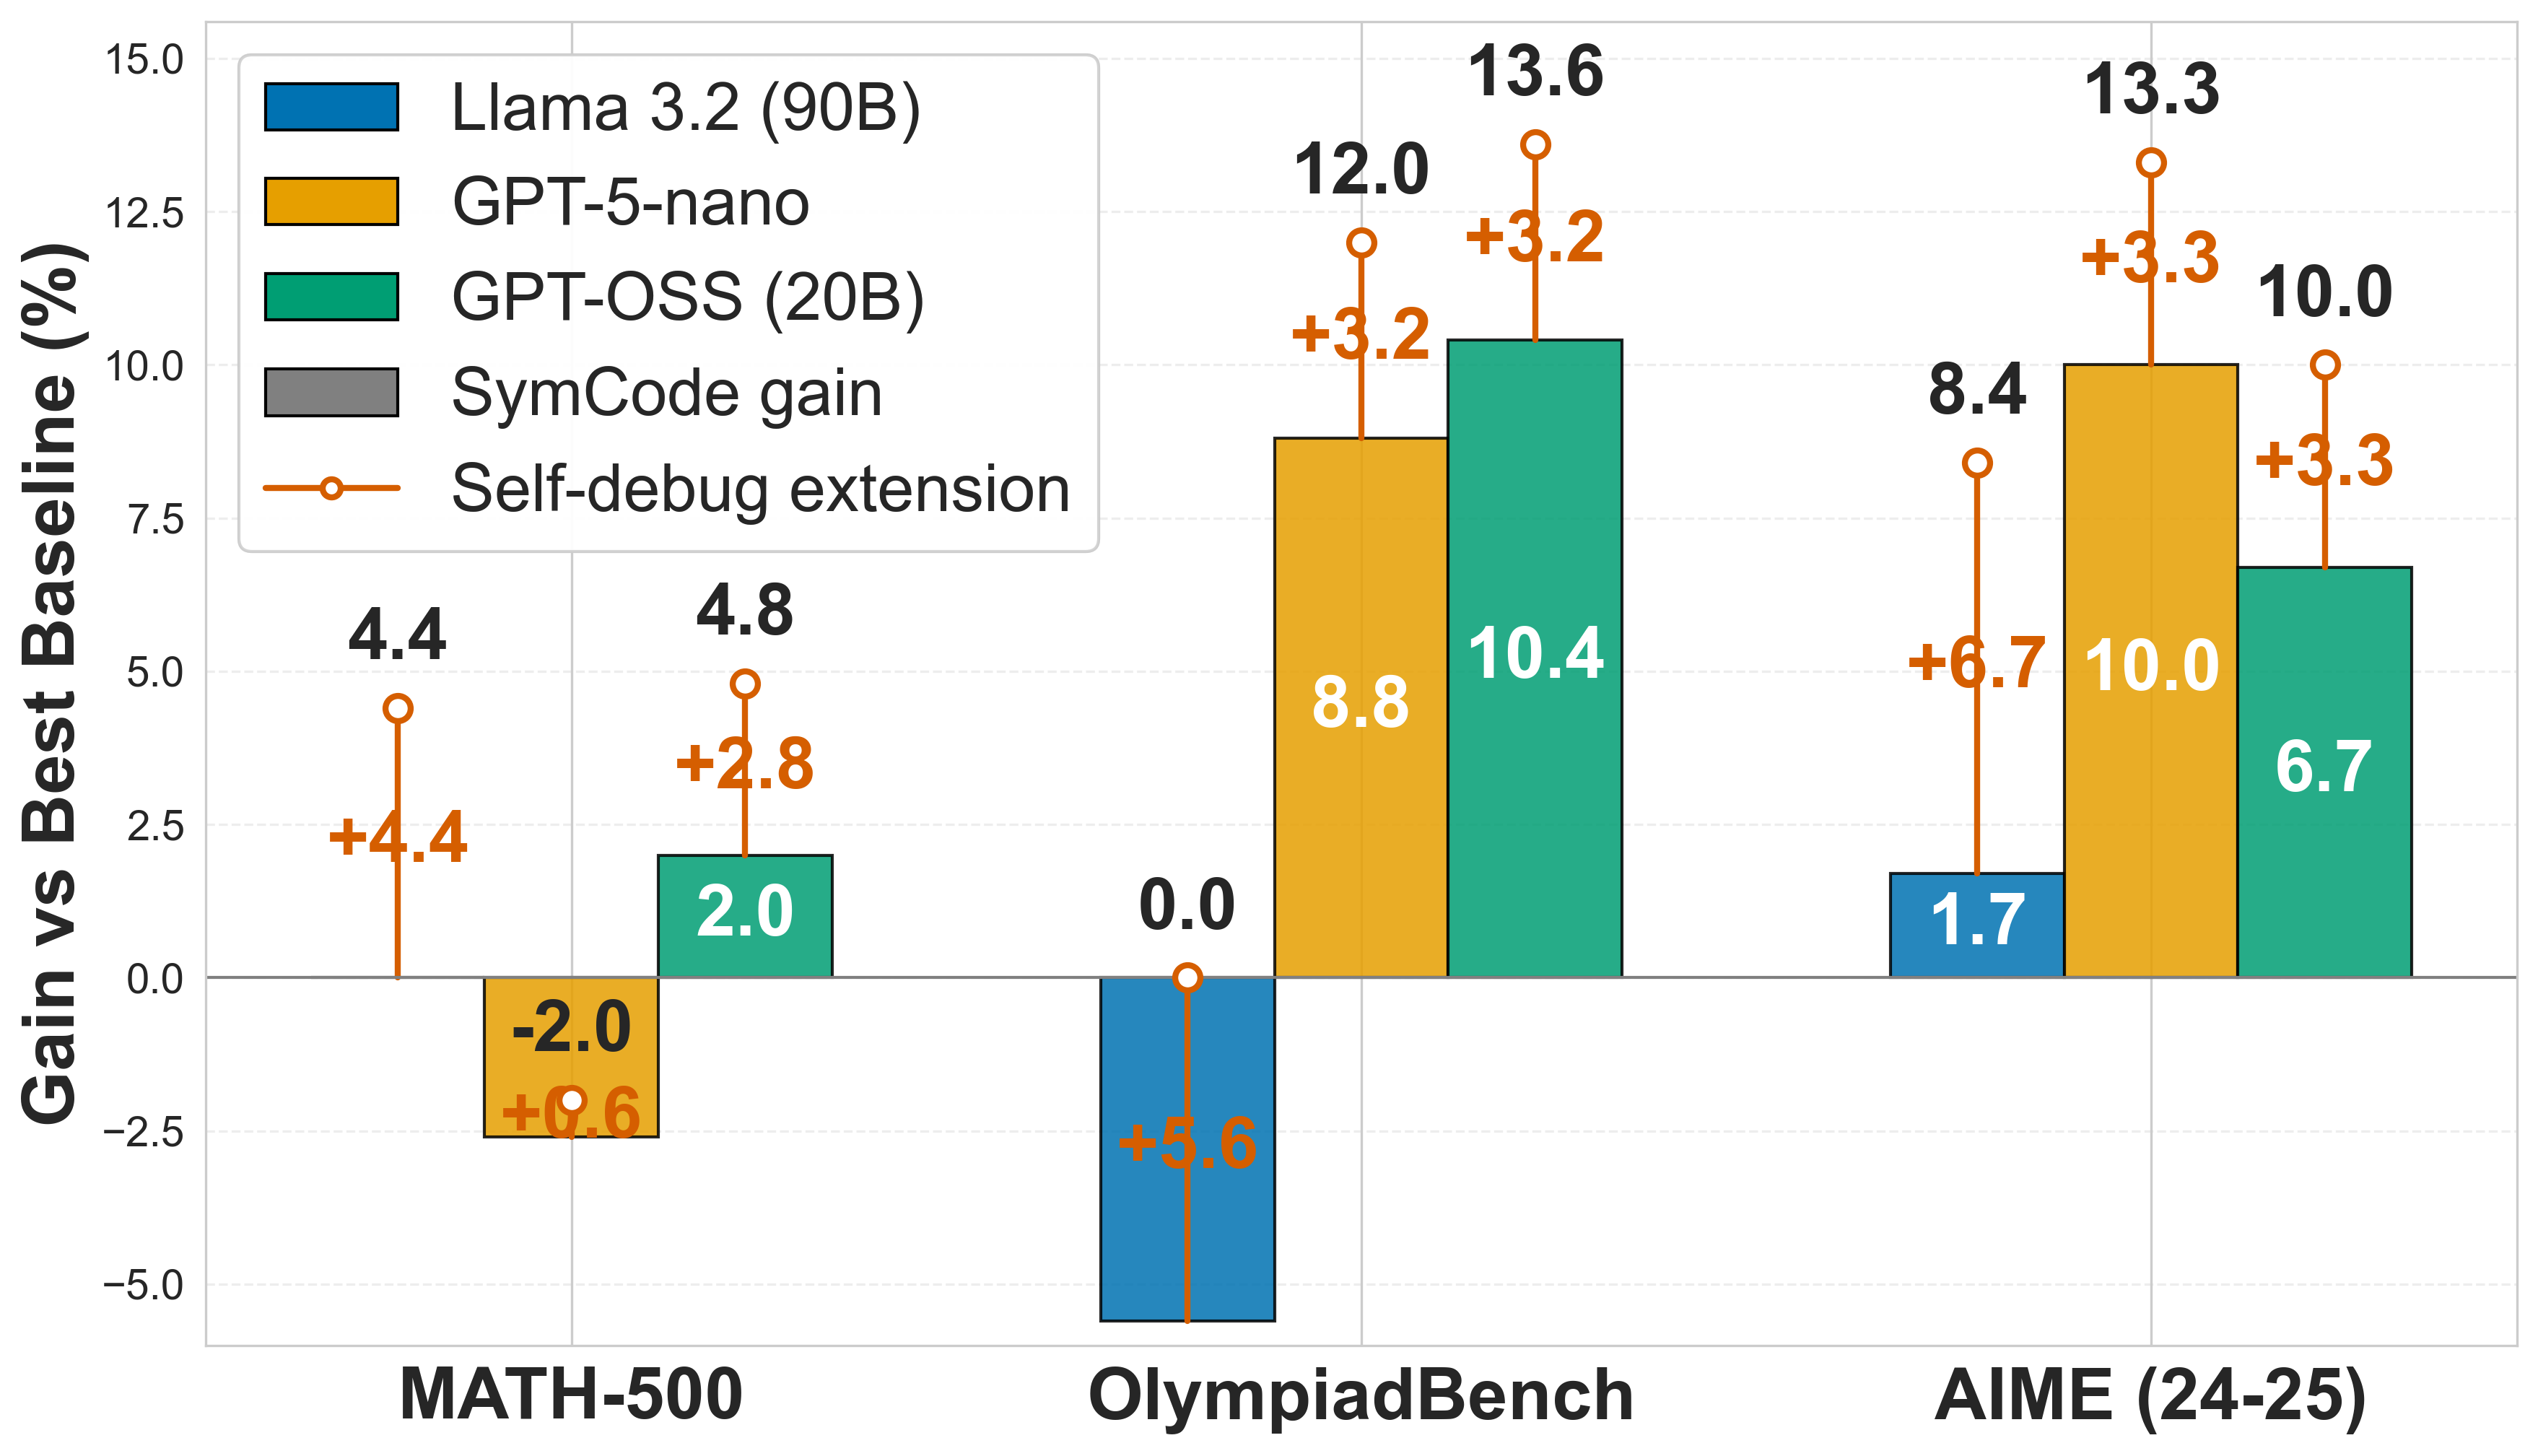
The image is a grouped bar chart comparing performance gains of different AI models against a baseline across three evaluation benchmarks. The chart includes error bars and a trend line for self-debug extension.
## Axes and Labels
- **X-axis**: Evaluation Benchmarks
- MATH-500
- OlympiadBench
- AIME (24-25)
- **Y-axis**: Gain vs Best Baseline (%)
- Range: -5.0% to 15.0%
- Tick intervals: 2.5% increments
## Legend
- **Location**: Top-left corner
- **Color-Coded Models**:
- Blue: Llama 3.2 (90B)
- Orange: GPT-5-nano
- Teal: GPT-OSS (20B)
- Gray: SymCode gain
- **Special Element**:
- Orange line with circle markers: Self-debug extension
## Data Points and Trends
### MATH-500
- **Llama 3.2 (90B)**: 4.4% gain (blue bar)
- **GPT-5-nano**: -2.0% gain (orange bar)
- **GPT-OSS (20B)**: 2.0% gain (teal bar)
- **SymCode gain**: 4.8% gain (gray bar)
- **Self-debug extension**: 0.6% gain (orange line marker)
### OlympiadBench
- **Llama 3.2 (90B)**: 0.0% gain (blue bar)
- **GPT-5-nano**: 8.8% gain (orange bar) with +3.2% improvement
- **GPT-OSS (20B)**: 10.4% gain (teal bar) with +3.2% improvement
- **SymCode gain**: 12.0% gain (gray bar)
- **Self-debug extension**: 5.6% gain (orange line marker)
### AIME (24-25)
- **Llama 3.2 (90B)**: 1.7% gain (blue bar)
- **GPT-5-nano**: 10.0% gain (orange bar) with +3.3% improvement
- **GPT-OSS (20B)**: 6.7% gain (teal bar) with +3.3% improvement
- **SymCode gain**: 13.3% gain (gray bar)
- **Self-debug extension**: 6.7% gain (orange line marker)
## Key Observations
1. **SymCode gain** consistently shows the highest performance across all benchmarks
2. **GPT-OSS (20B)** demonstrates significant improvements in OlympiadBench (+3.2%) and AIME (+3.3%)
3. **Self-debug extension** shows progressive improvement across benchmarks (0.6% → 5.6% → 6.7%)
4. **Llama 3.2 (90B)** has diminishing returns, with gains decreasing from 4.4% to 1.7%
## Color Verification
- All bar colors match legend specifications
- Self-debug extension line (orange) matches legend marker color
- Error bars maintain consistent color coding per model
## Spatial Grounding
- Legend positioned at [x=0.1, y=0.9] relative to chart area
- Bars grouped by benchmark with consistent spacing
- Line plot spans entire x-axis range
## Trend Verification
- **Llama 3.2 (90B)**: Slight downward trend (4.4% → 0.0% → 1.7%)
- **GPT-5-nano**: Steep upward trend (-2.0% → 8.8% → 10.0%)
- **GPT-OSS (20B)**: Peak at OlympiadBench (10.4%) followed by decline
- **SymCode gain**: Consistent upward trend (4.8% → 12.0% → 13.3%)
- **Self-debug extension**: Steady increase (0.6% → 5.6% → 6.7%)
## Error Bar Analysis
- **Largest variability**: OlympiadBench GPT-5-nano (+3.2% gain)
- **Smallest variability**: MATH-500 GPT-5-nano (+0.6% gain)
- **Most stable performance**: SymCode gain across all benchmarks
## Conclusion
The chart demonstrates significant performance variations between models, with SymCode gain consistently outperforming others. The self-debug extension shows promising scalability across different evaluation domains.