TECHNICAL ASSET FINGERPRINT
87be90e9bbbe0651624e84c7
Click to view fullscreen
Press ESC or click to close
FOUND IN PAPERS
EXPERT: healer-alpha-free VERSION 1
RUNTIME: free/openrouter/healer-alpha
INTEL_VERIFIED
## Bar Chart and Line Charts: Model Performance and Attention Analysis
### Overview
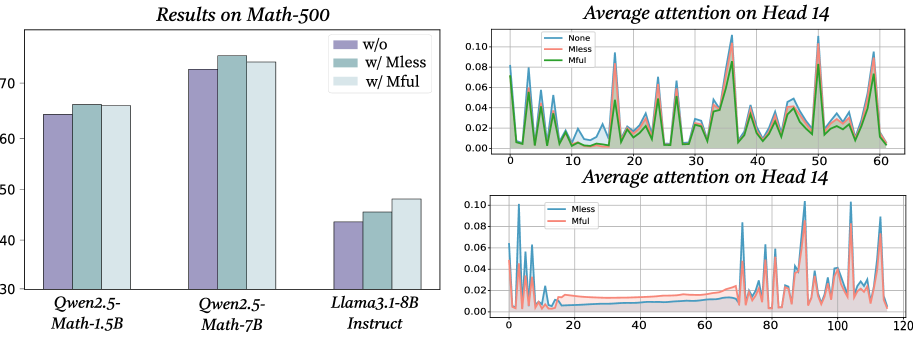
The image contains three distinct charts arranged in a composite layout. On the left is a grouped bar chart comparing the performance of three language models on a math benchmark under different conditions. On the right are two line charts stacked vertically, both analyzing "Average attention on Head 14" but under different conditions and over different token position ranges. The overall theme appears to be an analysis of how certain modifications ("Mless", "Mful") affect both model performance and internal attention mechanisms.
### Components/Axes
**1. Left Chart: "Results on Math-500"**
* **Type:** Grouped Bar Chart.
* **X-axis (Categorical):** Lists three model names: `Qwen2.5-Math-1.5B`, `Qwen2.5-Math-7B`, and `Llama3.1-8B Instruct`.
* **Y-axis (Numerical):** Represents a performance score, likely accuracy percentage. The scale runs from 30 to 75, with major ticks at 30, 40, 50, 60, 70.
* **Legend (Top-Right of chart area):** Defines three conditions:
* `w/o` (Purple bar)
* `w/ Mless` (Teal/Green bar)
* `w/ Mful` (Light Blue bar)
**2. Top-Right Chart: "Average attention on Head 14"**
* **Type:** Line Chart with filled area under the lines.
* **X-axis (Numerical):** Labeled with numbers from 0 to 60, representing token positions.
* **Y-axis (Numerical):** Represents average attention value. The scale runs from 0.00 to 0.10, with ticks at 0.00, 0.02, 0.04, 0.06, 0.08, 0.10.
* **Legend (Top-Left of chart area):** Defines three data series:
* `None` (Blue line)
* `Mless` (Red/Orange line)
* `Mful` (Green line)
**3. Bottom-Right Chart: "Average attention on Head 14"**
* **Type:** Line Chart.
* **X-axis (Numerical):** Labeled with numbers from 0 to 120, representing token positions.
* **Y-axis (Numerical):** Represents average attention value. The scale runs from 0.00 to 0.10, with ticks at 0.00, 0.02, 0.04, 0.06, 0.08, 0.10.
* **Legend (Top-Left of chart area):** Defines two data series:
* `Mless` (Blue line)
* `Mful` (Red/Orange line)
### Detailed Analysis
**1. Results on Math-500 (Bar Chart)**
* **Qwen2.5-Math-1.5B:**
* `w/o`: ~64%
* `w/ Mless`: ~66%
* `w/ Mful`: ~66%
* *Trend:* Performance is similar across conditions, with a slight improvement with Mless/Mful over the baseline (w/o).
* **Qwen2.5-Math-7B:**
* `w/o`: ~73%
* `w/ Mless`: ~76%
* `w/ Mful`: ~74%
* *Trend:* This model shows the highest overall performance. `w/ Mless` yields the best result, followed by `w/ Mful`, both outperforming the baseline.
* **Llama3.1-8B Instruct:**
* `w/o`: ~44%
* `w/ Mless`: ~46%
* `w/ Mful`: ~48%
* *Trend:* This model has the lowest scores. There is a clear, stepwise improvement from `w/o` to `w/ Mless` to `w/ Mful`.
**2. Average attention on Head 14 - Top Chart (Token positions 0-60)**
* **General Pattern:** All three lines (`None`, `Mless`, `Mful`) show a highly volatile, spiky pattern of attention across token positions. There is no smooth trend; attention values fluctuate dramatically between near 0.00 and peaks above 0.08.
* **Key Observations:**
* The `None` (blue) line often has the highest peaks, notably around positions ~5, ~18, ~35, ~50, and ~58, where it reaches or exceeds 0.10.
* The `Mless` (red) and `Mful` (green) lines generally follow the same spiky pattern as `None` but with slightly attenuated peaks. Their peaks are often lower than the corresponding `None` peak.
* The three lines are tightly correlated in their timing of spikes, suggesting the attention pattern's structure is preserved, but its magnitude is modulated by the conditions.
**3. Average attention on Head 14 - Bottom Chart (Token positions 0-120)**
* **General Pattern:** This chart compares only `Mless` (blue) and `Mful` (red) over a longer sequence. The pattern is again spiky but shows a distinct shift in behavior.
* **Key Observations:**
* **First ~70 tokens:** Both lines show low-amplitude fluctuations, mostly below 0.02, with occasional small spikes. The `Mful` (red) line appears slightly more active in this region.
* **After token ~70:** There is a dramatic change. Both lines begin exhibiting very high, sharp spikes, frequently reaching 0.08-0.10. The `Mful` (red) line shows particularly pronounced and frequent high spikes in the 80-120 range.
* The `Mless` (blue) line also spikes but seems to have slightly fewer extreme peaks in the later segment compared to `Mful`.
### Key Observations
1. **Performance Correlation:** The model showing the most significant performance gain from `Mful` (Llama3.1-8B Instruct) is also the one with the lowest baseline performance.
2. **Attention Modulation:** The modifications (`Mless`, `Mful`) do not create entirely new attention patterns but appear to modulate the intensity of the existing pattern seen in the `None` condition, generally reducing peak attention values in the short sequence (top chart).
3. **Attention Phase Shift:** The bottom chart reveals a potential phase shift in the model's attention behavior around the 70th token, moving from a low-attention state to a high-attention, spiky state. The `Mful` condition seems to exacerbate or make this high-attention state more volatile.
### Interpretation
The data suggests an investigation into how specific techniques (`Mless`, `Mful`) affect both the external performance and internal mechanics of language models on mathematical tasks.
* **Performance:** The techniques generally provide a performance boost, with the benefit being most pronounced for the weaker-performing model (Llama3.1-8B Instruct). This could imply the techniques help compensate for underlying model deficiencies in mathematical reasoning.
* **Attention Mechanism:** The line charts provide a "under the hood" view. Head 14 appears to be a highly dynamic attention head. The `Mless` and `Mful` conditions seem to act as a regularizer or dampener on its peak activity in shorter sequences (top chart). However, in longer sequences (bottom chart), a different dynamic emerges where attention becomes highly concentrated and volatile after a certain point, with `Mful` leading to more extreme attention spikes. This could indicate that `Mful` encourages the model to engage in more intense, focused processing at specific points in longer problems, which might correlate with the performance gains observed.
* **Relationship:** The charts together tell a story: modifying the model (with Mless/Mful) changes its internal attention dynamics (reducing peak attention in some contexts, increasing it in others), and these internal changes are associated with measurable improvements in external task performance. The outlier is the Llama model's dramatic stepwise improvement, suggesting it benefits most from the altered attention strategy.
DECODING INTELLIGENCE...