\n
## Charts/Graphs: Device Programming and Error Analysis
### Overview
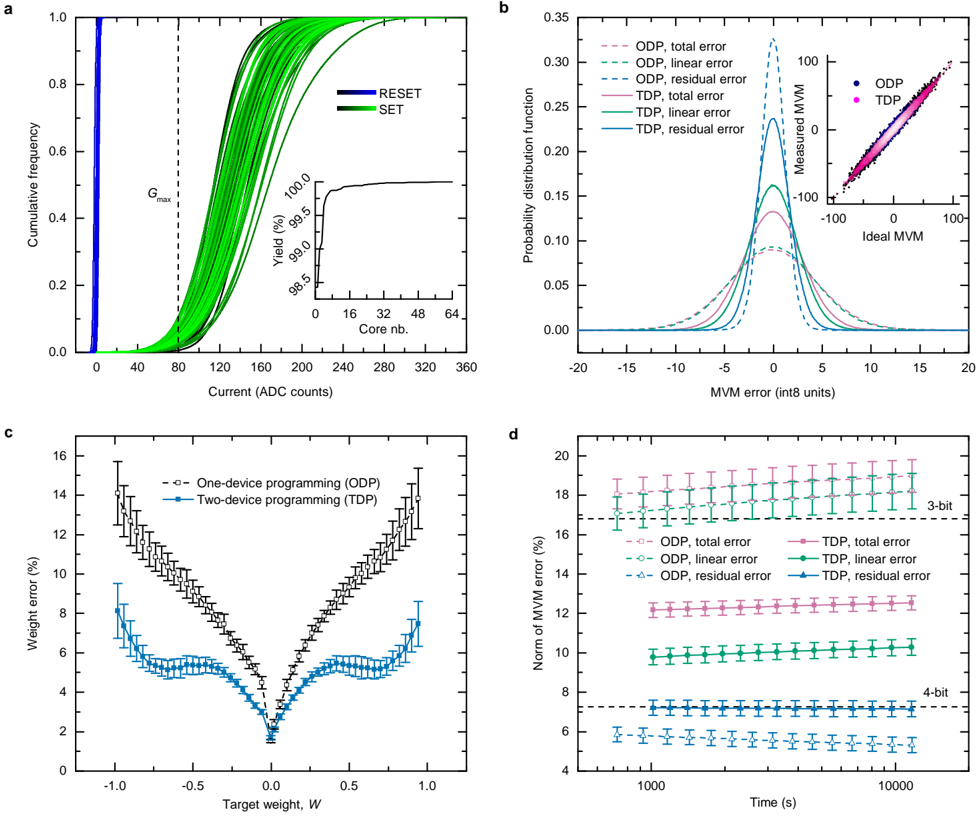
The image presents four charts (a, b, c, and d) related to device programming and error analysis. Chart (a) shows a cumulative frequency distribution of current (ADC counts) with inset showing yield vs core number. Chart (b) displays probability distribution functions of MVM error for different programming methods, with an inset showing measured vs ideal MVM. Chart (c) illustrates weight error as a function of target weight for one-device and two-device programming. Chart (d) shows the norm of MVM error over time for different error components and bit resolutions.
### Components/Axes
**Chart a:**
* **X-axis:** Current (ADC counts), ranging from 0 to 360.
* **Y-axis:** Cumulative frequency, ranging from 0.0 to 1.0.
* **Labels:** "Gmax" indicated on the curve. "RESET" and "SET" labels with arrows.
* **Inset:**
* **X-axis:** Core no., ranging from 0 to 64.
* **Y-axis:** Yield (%), ranging from 98.5 to 100.0.
**Chart b:**
* **X-axis:** MVM error (int8 units), ranging from -20 to 20.
* **Y-axis:** Probability distribution function, ranging from 0.0 to 0.35.
* **Legend (top-right):**
* ODP, total error (dashed red line)
* ODP, linear error (dotted red line)
* ODP, residual error (dashed green line)
* TDP, total error (dashed purple line)
* TDP, linear error (dotted purple line)
* TDP, residual error (dashed blue line)
* **Inset:**
* **X-axis:** Ideal MVM
* **Y-axis:** Measured MVM
**Chart c:**
* **X-axis:** Target weight, W, ranging from -1.0 to 1.0.
* **Y-axis:** Weight error (%), ranging from 2.0 to 16.0.
* **Legend (top-right):**
* One-device programming (ODP) (dashed black line with circle markers)
* Two-device programming (TDP) (dashed cyan line with cross markers)
**Chart d:**
* **X-axis:** Time (s), ranging from 1000 to 10000. Logarithmic scale.
* **Y-axis:** Norm of MVM error (%), ranging from 4.0 to 20.0.
* **Legend (top-right):**
* ODP, total error (dashed red line with circle markers)
* ODP, linear error (dotted red line with circle markers)
* ODP, residual error (dashed green line with circle markers)
* TDP, total error (dashed purple line with cross markers)
* TDP, linear error (dotted purple line with cross markers)
* TDP, residual error (dashed blue line with cross markers)
* **Annotations:** "3-bit" and "4-bit" labels indicating different bit resolutions.
### Detailed Analysis or Content Details
**Chart a:** The cumulative frequency curve shows a sigmoidal shape, indicating a gradual increase in cumulative frequency with increasing current. The curve plateaus around a cumulative frequency of 1.0 at approximately 320 ADC counts. The inset shows a yield curve that decreases slightly with increasing core number, starting at approximately 99.5% for core 0 and decreasing to around 98.5% for core 64.
**Chart b:** The probability distribution functions show that ODP (red lines) has a wider distribution than TDP (purple/blue lines). The total error (dashed lines) has a broader peak than the linear and residual errors (dotted and dashed lines, respectively). The inset shows a scatter plot of measured MVM versus ideal MVM.
**Chart c:** The ODP curve (black) shows a relatively smooth increase and decrease in weight error as the target weight varies from -1.0 to 1.0. The TDP curve (cyan) exhibits more oscillations, with higher error values at the extremes of the target weight range. At W = 0, ODP has approximately 4% error, while TDP has approximately 6% error. At W = 1.0, ODP has approximately 14% error, while TDP has approximately 12% error.
**Chart d:** The norm of MVM error for both ODP and TDP remains relatively stable over time for all error components. The 3-bit resolution data (top section) shows higher error values (around 16-18%) compared to the 4-bit resolution data (bottom section), which shows error values around 6-8%. The total error (dashed lines) is consistently higher than the linear and residual errors (dotted and dashed lines).
### Key Observations
* TDP generally exhibits lower weight error at positive target weights (Chart c) but higher weight error at negative target weights.
* The probability distribution of MVM error is wider for ODP than for TDP (Chart b).
* Higher bit resolution (4-bit) leads to significantly lower MVM error (Chart d).
* The residual error component is consistently the lowest across all programming methods and bit resolutions (Chart d).
* The Gmax value is indicated on the curve in Chart a.
### Interpretation
The data suggests that both one-device programming (ODP) and two-device programming (TDP) have trade-offs in terms of weight error and MVM error distribution. TDP appears to be more sensitive to target weight variations, while ODP exhibits a broader error distribution. The improvement in MVM error with higher bit resolution (from 3-bit to 4-bit) indicates that quantization error is a significant contributor to the overall error. The consistent dominance of total error over linear and residual errors suggests that both linear and non-linear effects contribute to the overall error. The inset in Chart b suggests a correlation between measured and ideal MVM, but with some deviation. The yield curve in Chart a indicates a slight decrease in yield with increasing core number, which could be due to variations in device characteristics across the chip. The "RESET" and "SET" labels in Chart a likely refer to the programming states of the device. Overall, the data provides insights into the performance and limitations of different device programming techniques and the impact of bit resolution on MVM error.