# Technical Document Extraction
## Bar Chart: LLM Inference Throughput Comparison
### Axes and Labels
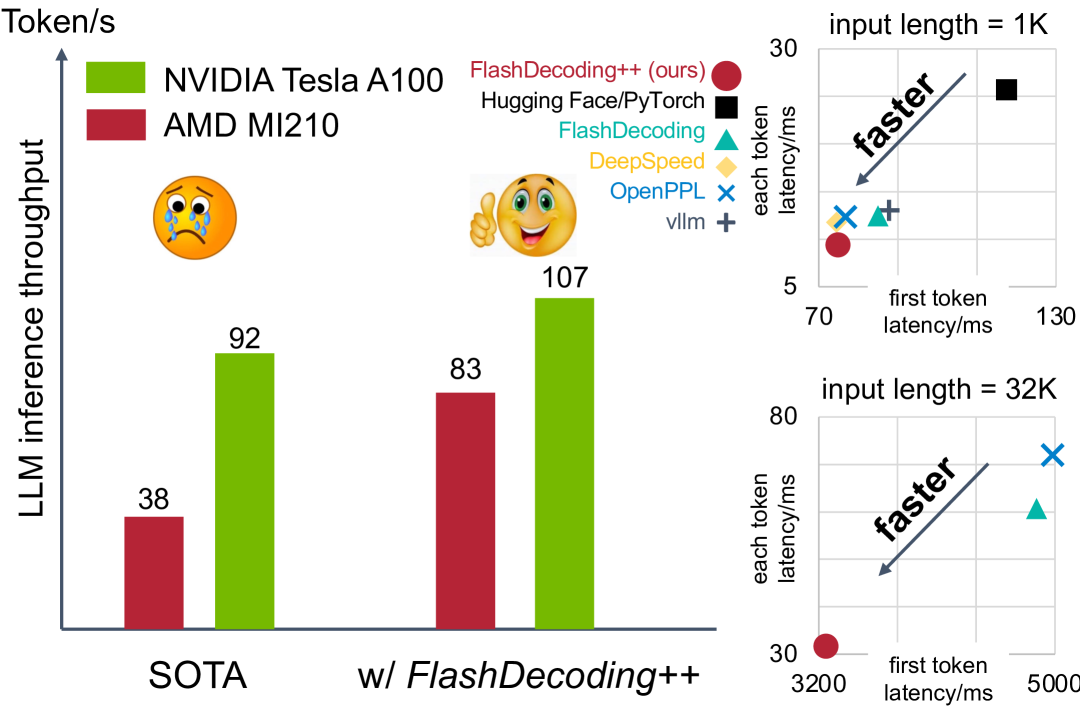
- **Y-axis**: "LLM inference throughput" (Token/s)
- **X-axis**:
- Categories: "SOTA", "w/ FlashDecoding++"
- **Legend**:
- **Color**: Green = NVIDIA Tesla A100, Red = AMD MI210
- **Placement**: Left side, above bars
### Data Points
| Category | AMD MI210 | NVIDIA Tesla A100 |
|-------------------|-----------|-------------------|
| **SOTA** | 38 | 92 |
| **w/ FlashDecoding++** | 83 | 107 |
### Annotations
- **SOTA**: 😢 (sad face emoji)
- **w/ FlashDecoding++**: 👍 (thumbs-up emoji)
---
## Line Charts: Latency Analysis
### Top Chart: Input Length = 1K
#### Axes and Labels
- **X-axis**: "first token latency/ms" (Range: 70–130)
- **Y-axis**: "each token latency/ms" (Range: 5–30)
- **Legend**:
- **Color/Marker**:
- Red circle = FlashDecoding++ (ours)
- Black square = Hugging Face/PyTorch
- Teal triangle = FlashDecoding
- Yellow diamond = DeepSpeed
- Blue cross = OpenPPL
- Gray plus = vllm
- **Placement**: Right side
#### Data Points
| Method | First Token Latency (ms) | Each Token Latency (ms) |
|----------------------|--------------------------|-------------------------|
| FlashDecoding++ | 70 | 5 |
| Hugging Face/PyTorch | 130 | 30 |
| FlashDecoding | 75 | 6 |
| DeepSpeed | 72 | 5.5 |
| OpenPPL | 78 | 7 |
| vllm | 80 | 8 |
#### Trends
- **Arrow**: Diagonal "faster" annotation pointing from (70, 5) to (130, 30).
---
## Bottom Chart: Input Length = 32K
#### Axes and Labels
- **X-axis**: "first token latency/ms" (Range: 3200–5000)
- **Y-axis**: "each token latency/ms" (Range: 30–80)
- **Legend**: Same as top chart (colors/markers).
#### Data Points
| Method | First Token Latency (ms) | Each Token Latency (ms) |
|----------------------|--------------------------|-------------------------|
| FlashDecoding++ | 3200 | 30 |
| Hugging Face/PyTorch | 5000 | 80 |
| FlashDecoding | 3300 | 35 |
| DeepSpeed | 3250 | 32 |
| OpenPPL | 3400 | 40 |
| vllm | 3500 | 45 |
#### Trends
- **Arrow**: Diagonal "faster" annotation pointing from (3200, 30) to (5000, 80).
---
## Key Observations
1. **Bar Chart**:
- NVIDIA Tesla A100 outperforms AMD MI210 in both SOTA and FlashDecoding++ scenarios.
- FlashDecoding++ improves throughput by ~21% for AMD (38 → 83) and ~16% for NVIDIA (92 → 107).
2. **Line Charts**:
- **1K Input**: FlashDecoding++ achieves the lowest latency (5 ms/token) with the fastest first token (70 ms).
- **32K Input**: FlashDecoding++ maintains the lowest latency (30 ms/token) despite higher first token latency (3200 ms).
3. **Legend Consistency**:
- All colors/markers in line charts match the legend (e.g., red circle = FlashDecoding++ in both charts).
4. **Efficiency Trends**:
- FlashDecoding++ scales better with longer input lengths (32K) compared to other methods.
- Hugging Face/PyTorch shows the worst performance in both charts.