## Image Comparison: Rendering Levels
### Overview
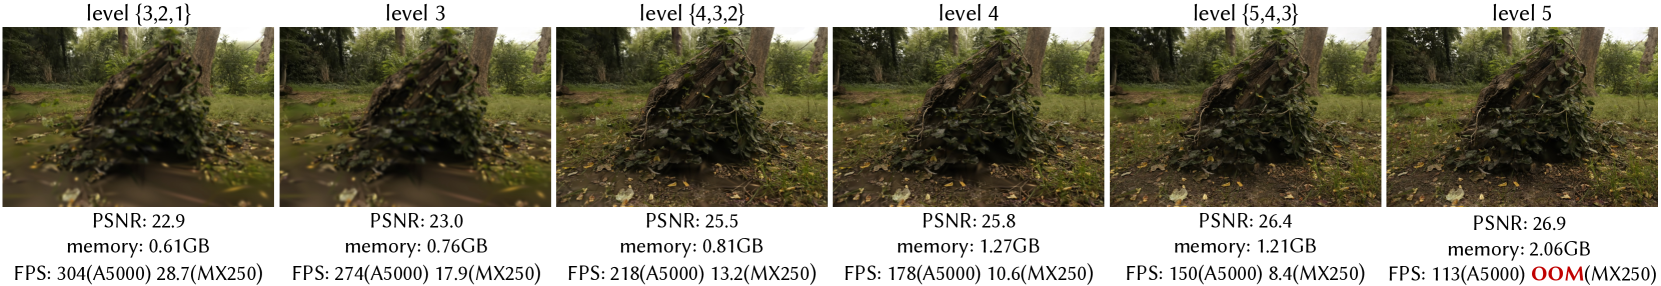
The image presents a side-by-side comparison of six renderings of the same scene, each rendered at a different level of detail. The scene appears to be a forest environment with a tree stump covered in foliage as the central subject. Each rendering is accompanied by performance metrics: PSNR (Peak Signal-to-Noise Ratio), memory usage, and FPS (Frames Per Second) on two different GPUs (A5000 and MX250).
### Components/Axes
* **Titles:** Each image has a title indicating the rendering level: "level {3,2,1}", "level 3", "level {4,3,2}", "level 4", "level {5,4,3}", and "level 5".
* **Images:** Six distinct renderings of the same scene.
* **Metrics:**
* PSNR: Peak Signal-to-Noise Ratio, a measure of image quality.
* Memory: Memory usage in GB.
* FPS: Frames Per Second, measured on A5000 and MX250 GPUs.
### Detailed Analysis or ### Content Details
**Image 1: level {3,2,1}**
* PSNR: 22.9
* Memory: 0.61GB
* FPS: 304 (A5000), 28.7 (MX250)
**Image 2: level 3**
* PSNR: 23.0
* Memory: 0.76GB
* FPS: 274 (A5000), 17.9 (MX250)
**Image 3: level {4,3,2}**
* PSNR: 25.5
* Memory: 0.81GB
* FPS: 218 (A5000), 13.2 (MX250)
**Image 4: level 4**
* PSNR: 25.8
* Memory: 1.27GB
* FPS: 178 (A5000), 10.6 (MX250)
**Image 5: level {5,4,3}**
* PSNR: 26.4
* Memory: 1.21GB
* FPS: 150 (A5000), 8.4 (MX250)
**Image 6: level 5**
* PSNR: 26.9
* Memory: 2.06GB
* FPS: 113 (A5000), OOM (MX250) - "OOM" likely stands for "Out Of Memory"
**Observations:**
* The PSNR generally increases with the rendering level, indicating improved image quality.
* Memory usage also generally increases with the rendering level.
* FPS decreases with the rendering level on both GPUs, indicating a performance trade-off for higher quality.
* The MX250 GPU runs out of memory at level 5.
### Key Observations
* **PSNR Trend:** PSNR increases as the level increases, suggesting better image quality at higher levels.
* **Memory Trend:** Memory consumption increases with the level, indicating more resources are used for higher quality rendering.
* **FPS Trend (A5000):** FPS decreases as the level increases, showing a performance cost for higher quality.
* **FPS Trend (MX250):** FPS decreases as the level increases, and at level 5, the MX250 runs out of memory.
* **Outlier:** The memory usage for level {5,4,3} is slightly lower than level 4, which is an unexpected deviation from the general trend.
### Interpretation
The data demonstrates the trade-off between rendering quality and performance. As the rendering level increases, the image quality (as measured by PSNR) improves, but the computational cost (memory usage and FPS) also increases. The MX250 GPU's "Out Of Memory" error at level 5 highlights the limitations of lower-end hardware when rendering at high detail levels. The slight decrease in memory usage at level {5,4,3} compared to level 4 could be due to optimization techniques or variations in the specific content being rendered at that level. Overall, the data suggests that the optimal rendering level depends on the available hardware and the desired balance between visual quality and performance.