## Image Analysis: Video Quality vs. Performance Trade-offs
### Overview
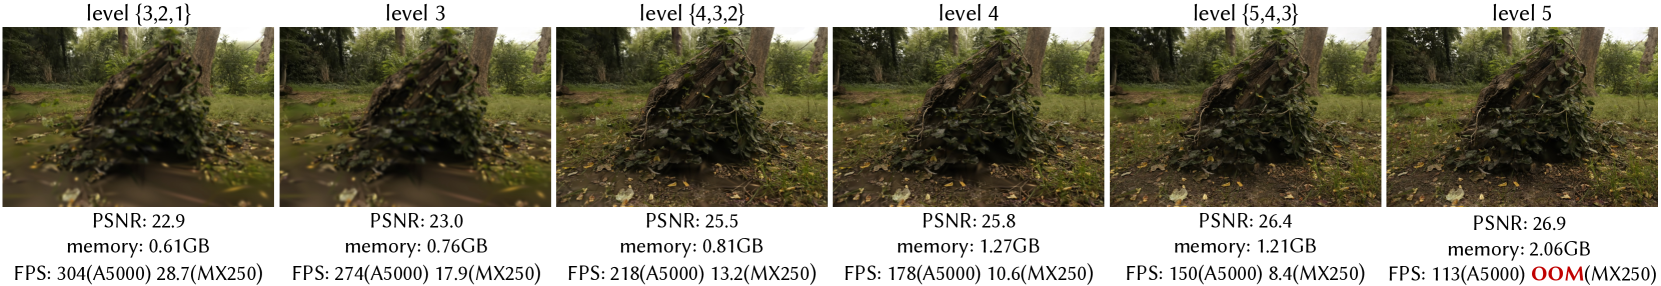
The image displays six side-by-side panels labeled "level {3,2,1}", "level 3", "level {4,3,2}", "level 4", "level {5,4,3}", and "level 5". Each panel shows a forest scene with a moss-covered tree stump, accompanied by technical metrics: Peak Signal-to-Noise Ratio (PSNR), memory usage, and Frames Per Second (FPS). The panels demonstrate a progression of increasing complexity (levels) with corresponding changes in quality and performance metrics.
### Components/Axes
- **Panels**: Six sequential levels of image processing complexity
- **Metrics**:
- **PSNR**: Measured in dB (higher = better quality)
- **Memory**: Measured in GB (higher = greater resource consumption)
- **FPS**: Measured in frames per second (higher = better performance)
- **Notation**:
- FPS values include two components:
- **(A5000)**: Likely GPU acceleration metric
- **(MX250)**: Likely CPU fallback metric
### Detailed Analysis
1. **Level {3,2,1}**
- PSNR: 22.9 dB
- Memory: 0.61 GB
- FPS: 304 (A5000) / 28.7 (MX250)
2. **Level 3**
- PSNR: 23.0 dB
- Memory: 0.76 GB
- FPS: 274 (A5000) / 17.9 (MX250)
3. **Level {4,3,2}**
- PSNR: 25.5 dB
- Memory: 0.81 GB
- FPS: 218 (A5000) / 13.2 (MX250)
4. **Level 4**
- PSNR: 25.8 dB
- Memory: 1.27 GB
- FPS: 178 (A5000) / 10.6 (MX250)
5. **Level {5,4,3}**
- PSNR: 26.4 dB
- Memory: 1.21 GB
- FPS: 150 (A5000) / 8.4 (MX250)
6. **Level 5**
- PSNR: 26.9 dB
- Memory: 2.06 GB
- FPS: 113 (A5000) / OOM (MX250) [Out of Memory error]
### Key Observations
1. **Quality-Resource Correlation**:
- PSNR increases by 4.0 dB (22.9 → 26.9) across levels
- Memory consumption increases by 240% (0.61 → 2.06 GB)
- FPS decreases by 63% (304 → 113) on A5000 GPU
2. **Performance Degradation**:
- GPU acceleration (A5000) maintains higher FPS than CPU (MX250) across all levels
- CPU performance collapses at Level 5 (OOM error)
3. **Non-linear Scaling**:
- Memory usage plateaus between Levels 3-4 (0.76 → 1.27 GB)
- FPS decline accelerates after Level 4 (178 → 113)
### Interpretation
This visualization demonstrates a classic quality-performance trade-off in video processing:
- **Higher Levels** improve perceptual quality (PSNR) but require exponentially more resources
- The GPU (A5000) maintains stable performance until Level 5, where both GPU and CPU fail
- The OOM error at Level 5 suggests architectural limitations in memory management
- The MX250 CPU's inability to handle Level 5 indicates fundamental hardware constraints
The data implies that Level 4 ({5,4,3}) represents the optimal balance point, achieving 26.4 dB PSNR with 1.21 GB memory while maintaining 150 FPS on A5000. Level 5's OOM error suggests either algorithmic inefficiencies or hardware limitations in handling complex scenes.