## Diagram: Causal Diagrams
### Overview
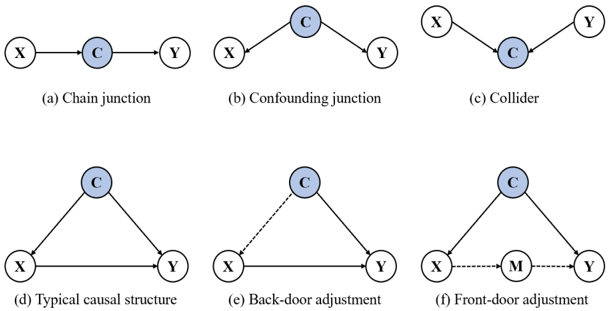
The image presents six different causal diagrams, each illustrating a specific type of relationship between variables X, Y, C, and M. These diagrams use nodes (circles) to represent variables and arrows to represent causal relationships. The diagrams are labeled (a) through (f), each with a descriptive title.
### Components/Axes
* **Nodes:** Represented by circles, labeled X, Y, C, and M.
* **Arrows:** Indicate the direction of causal influence. Solid arrows represent direct causal effects, while dashed arrows represent adjustments or alternative pathways.
* **Blue Filled Nodes:** The node labeled 'C' is filled with a light blue color in each diagram.
* **Labels:** (a) Chain junction, (b) Confounding junction, (c) Collider, (d) Typical causal structure, (e) Back-door adjustment, (f) Front-door adjustment.
### Detailed Analysis
* **(a) Chain junction:** X -> C -> Y. X causes C, and C causes Y.
* **(b) Confounding junction:** X -> C <- Y. Both X and Y cause C.
* **(c) Collider:** X <- C -> Y. C is caused by both X and Y.
* **(d) Typical causal structure:** C -> Y <- X. Both X and C cause Y.
* **(e) Back-door adjustment:** C -> Y, X -> Y, X -- > C (dashed). C causes Y, X causes Y, and X has a dashed arrow to C, indicating a back-door path.
* **(f) Front-door adjustment:** C -> Y, X --> M --> Y (dashed). C causes Y, and X has a dashed arrow to M, which has a dashed arrow to Y, indicating a front-door path.
### Key Observations
* The variable 'C' appears in all diagrams, often acting as a mediator, confounder, or collider.
* Dashed arrows are used to indicate adjustments or alternative pathways in the back-door and front-door adjustment diagrams.
* The direction of the arrows is crucial in determining the type of causal relationship.
### Interpretation
The diagrams illustrate fundamental causal structures and adjustment techniques used in causal inference. They demonstrate how different relationships between variables can lead to confounding or mediation effects, and how back-door and front-door adjustments can be used to estimate causal effects in the presence of these complexities. The diagrams are useful for understanding and visualizing causal relationships in various domains.