## Diagram Type: Causal Diagrams
### Overview
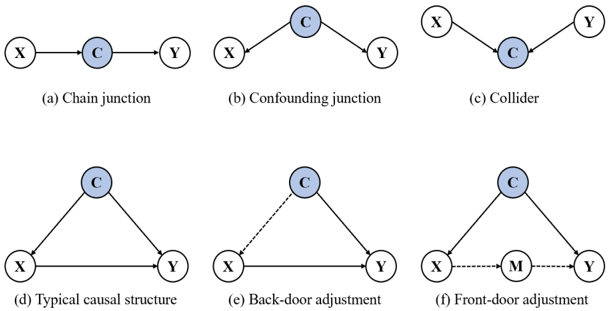
The image displays a series of six causal diagrams, each representing different types of causal relationships between variables X, Y, and C. The diagrams are labeled (a) through (f) and illustrate various configurations of causal interactions.
### Components/Axes
- **Variables**: X, Y, and C are the main variables represented in the diagrams.
- **Causal Relationships**: The diagrams show different types of causal relationships, including chain junctions, confounding junctions, colliders, typical causal structures, back-door adjustments, and front-door adjustments.
- **Axes**: There are no axes present in the diagrams, as they are graphical representations of causal relationships.
### Detailed Analysis or ### Content Details
- **Chain Junction**: Diagram (a) shows a simple chain where X causes C, which then causes Y.
- **Confounding Junction**: Diagram (b) illustrates a confounding junction where X causes C, and C causes Y, but there is also a direct path from X to Y.
- **Collider**: Diagram (c) depicts a collider where X causes C, and C causes Y, but there is also a direct path from Y to X.
- **Typical Causal Structure**: Diagram (d) shows a typical causal structure where X causes C, and C causes Y.
- **Back-door Adjustment**: Diagram (e) represents a back-door adjustment where X causes C, and C causes Y, but there is a collider (M) that blocks the direct path from X to Y.
- **Front-door Adjustment**: Diagram (f) illustrates a front-door adjustment where X causes C, and C causes Y, but there is a collider (M) that blocks the direct path from X to Y.
### Key Observations
- **Notable Patterns**: The diagrams show how different causal relationships can affect the interpretation of data and the identification of causal effects.
- **Outliers**: There are no outliers or anomalies present in the diagrams.
### Interpretation
The data in the diagrams suggests that the causal relationships between X, Y, and C can be complex and multifaceted. The diagrams demonstrate how different types of causal relationships can influence the interpretation of data and the identification of causal effects. The back-door and front-door adjustments highlight the importance of controlling for confounding variables to accurately estimate causal effects. The diagrams serve as a visual tool for understanding and analyzing causal relationships in various contexts.