## Diagram: Causal Structure Types
### Overview
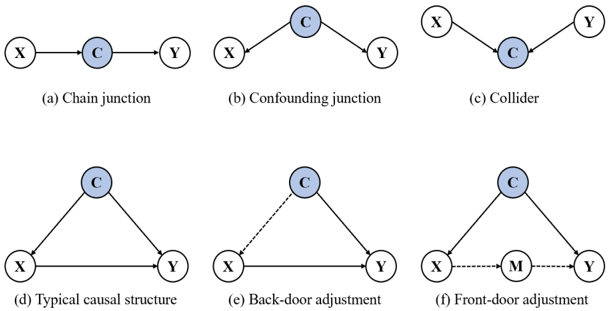
The image presents six labeled panels (a–f) illustrating different causal relationships and adjustment methods in a graphical model. Each panel uses nodes (X, Y, C, M) connected by directed arrows to represent causal pathways.
### Components/Axes
- **Nodes**:
- **X**: Independent variable (e.g., treatment, exposure).
- **Y**: Outcome variable.
- **C**: Confounder (common cause of X and Y).
- **M**: Mediator (variable influenced by X and affecting Y).
- **Arrows**:
- Solid arrows indicate direct causal relationships.
- Dashed arrows represent adjustments (e.g., conditioning, blocking).
### Detailed Analysis
#### Panel (a) Chain Junction
- Structure: X → C → Y.
- Description: A simple causal chain where X influences C, which in turn influences Y.
#### Panel (b) Confounding Junction
- Structure: X → C ← Y.
- Description: A confounder (C) is a common cause of both X and Y, creating a spurious association between X and Y.
#### Panel (c) Collider
- Structure: X ← C → Y.
- Description: C is a collider (common effect of X and Y). Conditioning on C introduces a spurious association between X and Y.
#### Panel (d) Typical Causal Structure
- Structure: X → C → Y and X → Y.
- Description: X directly affects Y and also influences Y indirectly through C.
#### Panel (e) Back-Door Adjustment
- Structure: X ← C → Y with a dashed arrow from X to Y.
- Description: Adjusting for C (back-door) blocks the confounding path between X and Y.
#### Panel (f) Front-Door Adjustment
- Structure: X → M → C → Y and X → Y.
- Description: Adjusting for M (front-door) isolates the direct effect of X on Y by blocking the indirect path through C.
### Key Observations
1. **Collider Bias**: Panel (c) highlights the risk of conditioning on a collider, which can create false associations.
2. **Adjustment Methods**: Panels (e) and (f) demonstrate causal inference techniques to isolate direct/indirect effects.
3. **Mediator Role**: Panel (f) introduces M as a mediator, emphasizing the importance of distinguishing direct and indirect effects.
### Interpretation
This diagram illustrates foundational concepts in causal inference:
- **Causal Chains**: Panels (a) and (d) show direct and indirect effects.
- **Confounding**: Panel (b) emphasizes the need to adjust for confounders to avoid biased estimates.
- **Collider Caution**: Panel (c) warns against conditioning on colliders, which can distort results.
- **Adjustment Strategies**: Panels (e) and (f) provide methods to disentangle causal pathways, critical for accurate causal analysis.
The absence of numerical data or axes suggests this is a conceptual diagram, not a statistical chart. The focus is on visualizing causal relationships and adjustment strategies rather than quantifying effects.