## Diagram: Mathematical Inequality Expression
### Overview
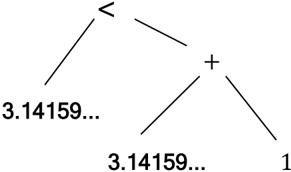
The image depicts a simple mathematical diagram illustrating an inequality. It features a central "+" operator connected to two branches. The left branch includes a "<" symbol and the value "3.14159...", while the right branch shows the same value "3.14159..." and the number "1".
### Components/Axes
- **Central Operator**: A "+" symbol positioned at the top center of the diagram.
- **Left Branch**:
- A "<" symbol (less-than) located on the left branch.
- The value "3.14159..." (approximation of π) at the bottom of the left branch.
- **Right Branch**:
- The value "3.14159..." (approximation of π) at the bottom of the right branch.
- The number "1" at the bottom-right corner of the diagram.
### Detailed Analysis
- The diagram visually represents the inequality:
**"3.14159... < 3.14159... + 1"**.
- The left branch explicitly marks the comparison operator "<", indicating that the value on the left ("3.14159...") is less than the sum of the right branch's values ("3.14159..." + "1").
- Both branches share the same base value ("3.14159..."), but the right branch includes an additional "+1" term.
### Key Observations
- The use of "3.14159..." (π) suggests the diagram may relate to geometric or numerical comparisons involving π.
- The equality of the base values on both branches emphasizes that the inequality arises solely from the addition of "1" to the right side.
- The "<" symbol is spatially aligned with the left branch, reinforcing the direction of the inequality.
### Interpretation
This diagram demonstrates a fundamental mathematical truth: adding a positive value (1) to a number (π) results in a larger value. The repetition of "3.14159..." on both sides highlights that the inequality is not dependent on the specific value of π but rather on the operation of addition. The diagram serves as a visual aid to clarify the relationship between the components of the inequality.
**Note**: The image does not contain numerical data for trend analysis or statistical interpretation. It is a static representation of a mathematical expression.