\n
## Diagram: Mathematical Relationship
### Overview
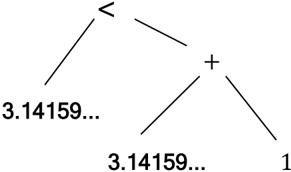
The image depicts a simple diagram illustrating a mathematical relationship involving the number Pi (approximately 3.14159...) and the number 1, connected by addition and a less-than symbol. It appears to be a visual representation of an inequality.
### Components/Axes
The diagram consists of the following elements:
* A less-than symbol (<) positioned at the top-left.
* An addition symbol (+) positioned centrally.
* The number "3.14159..." appearing twice, once connected to the less-than symbol and once connected to the addition symbol.
* The number "1" connected to the addition symbol.
* Lines connecting these symbols and numbers, forming a triangular structure.
### Detailed Analysis or Content Details
The diagram visually represents the following relationship:
3. 14159... < 3.14159... + 1
The diagram shows that Pi (represented as 3.14159...) is less than Pi plus 1.
### Key Observations
The diagram is a simple illustration of a basic mathematical principle. The use of "3.14159..." suggests the representation of Pi. The diagram is visually balanced, with the addition symbol acting as a central point.
### Interpretation
The diagram demonstrates a fundamental mathematical truth: adding a positive number (1) to a value (Pi) always results in a larger value. The less-than symbol clearly indicates that Pi is smaller than Pi + 1. This is a straightforward illustration of addition and inequality. The diagram is likely intended as a visual aid for understanding these concepts, rather than presenting complex data or analysis. It's a pedagogical tool.