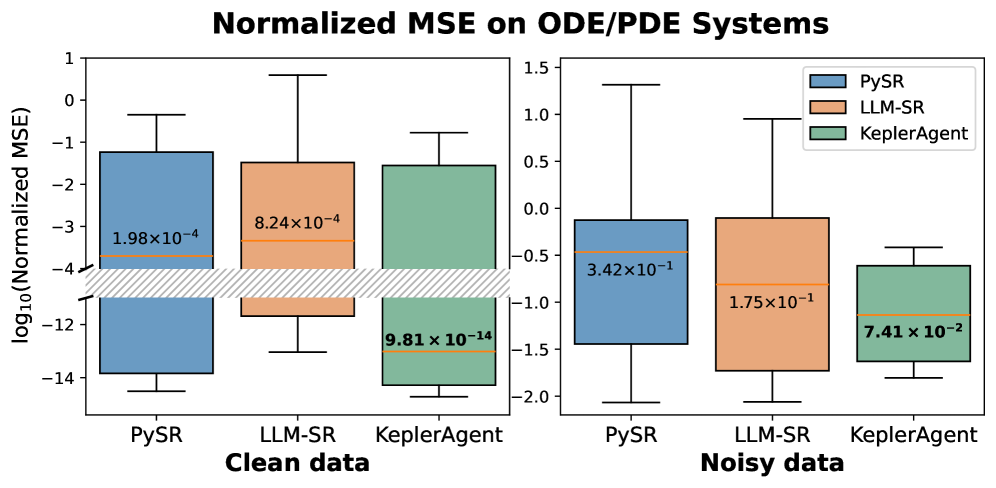
## Box Plot: Normalized MSE on ODE/PDE Systems
### Overview
The image presents two box plots comparing the performance of three algorithms (PySR, LLM-SR, and KeplerAgent) on Ordinary Differential Equation (ODE) and Partial Differential Equation (PDE) systems. The left plot shows results for "Clean data," while the right plot shows results for "Noisy data." The y-axis represents the base-10 logarithm of the normalized Mean Squared Error (MSE).
### Components/Axes
* **Title:** Normalized MSE on ODE/PDE Systems
* **Y-axis:** log10(Normalized MSE)
* Scale: -14 to 1 on the left plot, -2.0 to 1.5 on the right plot.
* **X-axis (Left Plot):** Clean data
* Categories: PySR, LLM-SR, KeplerAgent
* **X-axis (Right Plot):** Noisy data
* Categories: PySR, LLM-SR, KeplerAgent
* **Legend (Top-Right):**
* Blue: PySR
* Orange: LLM-SR
* Green: KeplerAgent
* **Horizontal Striped Region:** This region spans from approximately -4 to -11 on the y-axis of the left plot. It is not explicitly labeled, but it visually separates the performance of the algorithms on clean data.
### Detailed Analysis
**Left Plot: Clean Data**
* **PySR (Blue):** The box extends from approximately -14 to -1. The median is at 1.98 x 10^-4, which is approximately -3.7 on the log scale.
* **LLM-SR (Orange):** The box extends from approximately -12 to -0.5. The median is at 8.24 x 10^-4, which is approximately -3.1 on the log scale.
* **KeplerAgent (Green):** The box extends from approximately -14 to -0.75. The median is at 9.81 x 10^-14, which is approximately -13 on the log scale.
**Right Plot: Noisy Data**
* **PySR (Blue):** The box extends from approximately -2 to 1.3. The median is at 3.42 x 10^-1, which is approximately -0.47 on the log scale.
* **LLM-SR (Orange):** The box extends from approximately -1.75 to 1. The median is at 1.75 x 10^-1, which is approximately -0.76 on the log scale.
* **KeplerAgent (Green):** The box extends from approximately -1.75 to 0.5. The median is at 7.41 x 10^-2, which is approximately -1.13 on the log scale.
### Key Observations
* On clean data, KeplerAgent exhibits significantly lower MSE values compared to PySR and LLM-SR.
* On noisy data, all three algorithms show a substantial increase in MSE compared to their performance on clean data.
* KeplerAgent still performs best on noisy data, but the difference between the algorithms is less pronounced than with clean data.
* The striped region on the left plot visually separates the MSE values for clean data, highlighting the superior performance of KeplerAgent.
### Interpretation
The box plots demonstrate the impact of noise on the performance of three different algorithms for solving ODE/PDE systems. The results suggest that KeplerAgent is more robust to noise than PySR and LLM-SR, as it maintains a lower MSE even in the presence of noisy data. The striped region on the left plot emphasizes the significant difference in performance between KeplerAgent and the other algorithms when dealing with clean data. The increase in MSE for all algorithms in the noisy data scenario indicates that noise poses a significant challenge for these methods.