## Box Plot: Normalized MSE on ODE/PDE Systems
### Overview
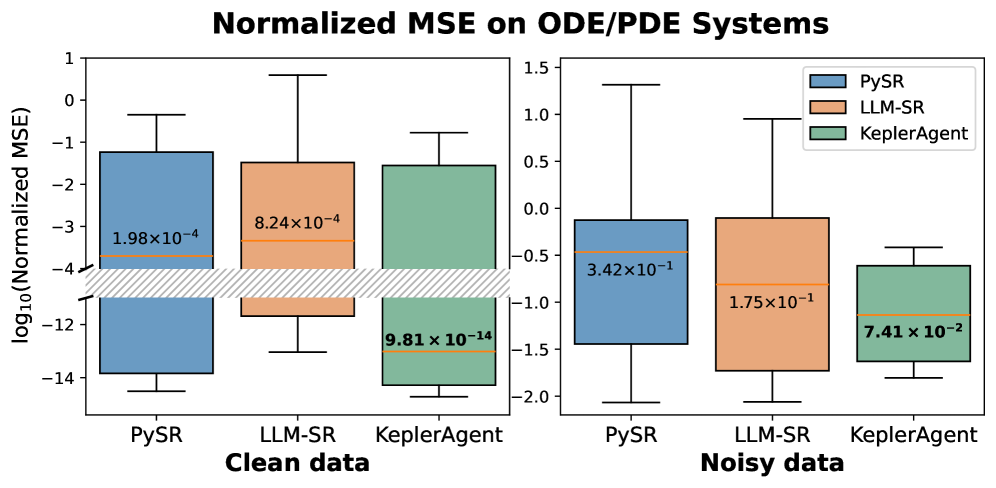
The image presents two sets of box plots comparing the performance of three methods – PySR, LLM-SR, and KeplerAgent – on Ordinary Differential Equation (ODE) and Partial Differential Equation (PDE) systems. The left box plot shows results for "Clean data", while the right box plot shows results for "Noisy data". The metric used for comparison is the Normalized Mean Squared Error (MSE), displayed on a logarithmic scale (log10).
### Components/Axes
* **Title:** "Normalized MSE on ODE/PDE Systems" (centered at the top)
* **X-axis:** Method names: "PySR", "LLM-SR", "KeplerAgent" (repeated for both "Clean data" and "Noisy data" plots).
* **Y-axis:** "log10(Normalized MSE)" (ranging approximately from -14 to 1).
* **Legend:** Located in the top-right corner of the "Noisy data" plot.
* PySR (Blue)
* LLM-SR (Orange)
* KeplerAgent (Brown)
* **Data Representation:** Box plots showing the distribution of Normalized MSE values for each method under each data condition. Each box plot includes the median, quartiles, and whiskers representing the range of the data.
* **Data Labels:** Each box plot has a label indicating the approximate median value of the Normalized MSE.
### Detailed Analysis or Content Details
**Clean Data (Left Plot)**
* **PySR (Blue):** The box plot is relatively narrow, indicating low variance. The median value is approximately -3.2, with a label of 1.98 x 10^-4. The whiskers extend from approximately -4 to -2.
* **LLM-SR (Orange):** The box plot is wider than PySR, suggesting higher variance. The median value is approximately -2.7, with a label of 8.24 x 10^-4. The whiskers extend from approximately -4 to -1.5.
* **KeplerAgent (Brown):** The box plot is the widest of the three, indicating the highest variance. The median value is approximately -2.5, with a label of 9.81 x 10^-14. The whiskers extend from approximately -4 to -1.
**Noisy Data (Right Plot)**
* **PySR (Blue):** The box plot is relatively wide. The median value is approximately -0.2, with a label of 3.42 x 10^-1. The whiskers extend from approximately -0.7 to 1.2.
* **LLM-SR (Orange):** The box plot is narrower than PySR. The median value is approximately -0.8, with a label of 1.75 x 10^-1. The whiskers extend from approximately -1.5 to 0.5.
* **KeplerAgent (Brown):** The box plot is relatively narrow. The median value is approximately -1.1, with a label of 7.41 x 10^-2. The whiskers extend from approximately -1.8 to -0.5.
### Key Observations
* **Clean Data:** PySR consistently achieves the lowest Normalized MSE, indicating the best performance on clean data. KeplerAgent has the highest median MSE and the largest spread, suggesting the least reliable performance.
* **Noisy Data:** The performance of all methods degrades significantly with noisy data, as expected. PySR still performs best, but the difference between methods is less pronounced than in the clean data case.
* **Variance:** KeplerAgent exhibits the highest variance in both clean and noisy data scenarios, indicating its performance is the most sensitive to variations in the data.
* **Scale:** The Y-axis is logarithmic, which compresses the range of MSE values. This is important to note when interpreting the differences between methods.
### Interpretation
The data suggests that PySR is the most robust and accurate method for solving ODE/PDE systems, particularly when the data is clean. LLM-SR performs reasonably well, but with higher variance. KeplerAgent is the least reliable, exhibiting the highest variance and generally the worst performance. The significant performance drop for all methods when switching from clean to noisy data highlights the importance of data quality in these types of problems. The logarithmic scale emphasizes the relative differences in MSE, making it easier to compare the performance of the methods across a wide range of error values. The wider boxes for KeplerAgent indicate that its performance is more sensitive to the specific ODE/PDE system being solved, or to the specific noise realization. This could be due to its reliance on a more complex or less stable learning process.