## Box Plot: NormalizedMSE on ODE/PDE Systems
### Overview
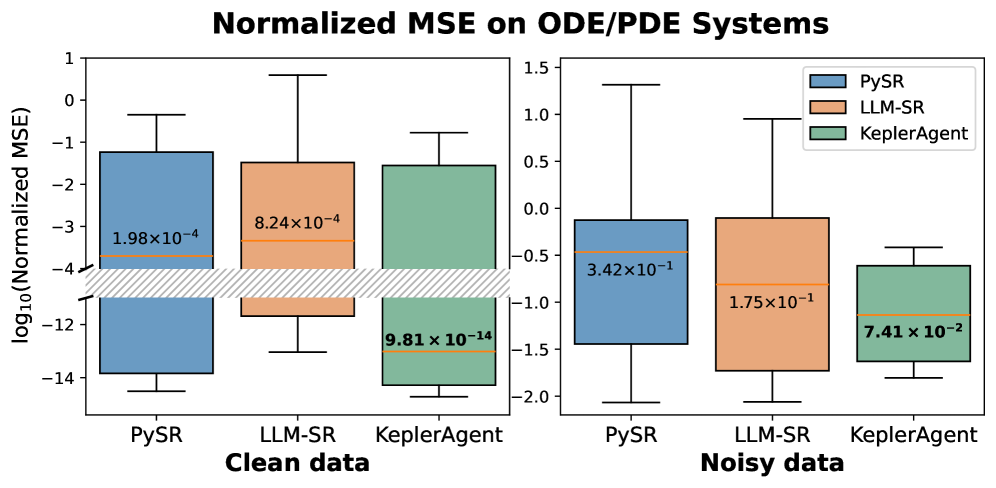
The image compares the performance of three methods (PySR, LLM-SR, KeplerAgent) on ODE/PDE systems using normalized mean squared error (MSE). Two scenarios are shown: **clean data** (left) and **noisy data** (right). Results are presented on a logarithmic scale (log₁₀) for MSE values.
---
### Components/Axes
- **X-axis (Categories)**:
- Left plot: "Clean data" (three subcategories: PySR, LLM-SR, KeplerAgent)
- Right plot: "Noisy data" (same subcategories)
- **Y-axis**:
- Label: "log₁₀(Normalized MSE)"
- Range: -14 to 1 (logarithmic scale)
- **Legend**:
- Position: Top-right of both plots
- Colors:
- PySR: Blue
- LLM-SR: Orange
- KeplerAgent: Green
- **Box Plot Elements**:
- Median: Horizontal line within each box
- Mean: Orange line with scientific notation labels
- Whiskers: Extend to min/max values (excluding outliers)
---
### Detailed Analysis
#### Clean Data (Left Plot)
- **PySR (Blue)**:
- Median: ~-3.5 (log₁₀ scale)
- Mean: 1.98×10⁻⁴ (orange line)
- Range: ~-12 to -1 (whiskers)
- **LLM-SR (Orange)**:
- Median: ~-2.5
- Mean: 8.24×10⁻⁴
- Range: ~-10 to 0
- **KeplerAgent (Green)**:
- Median: ~-4.5
- Mean: 9.81×10⁻¹⁴
- Range: ~-14 to -2
#### Noisy Data (Right Plot)
- **PySR (Blue)**:
- Median: ~-0.5
- Mean: 3.42×10⁻¹
- Range: ~-2 to 1
- **LLM-SR (Orange)**:
- Median: ~-1
- Mean: 1.75×10⁻¹
- Range: ~-1.5 to 0.5
- **KeplerAgent (Green)**:
- Median: ~-1.5
- Mean: 7.41×10⁻²
- Range: ~-2 to -0.5
---
### Key Observations
1. **KeplerAgent Dominates**:
- Achieves the lowest MSE in both clean and noisy data (orders of magnitude better than others).
- Mean MSE in clean data: **9.81×10⁻¹⁴** (vs. PySR: 1.98×10⁻⁴, LLM-SR: 8.24×10⁻⁴).
- In noisy data: **7.41×10⁻²** (vs. PySR: 3.42×10⁻¹, LLM-SR: 1.75×10⁻¹).
2. **Robustness to Noise**:
- KeplerAgent maintains superior performance even with noisy data, while PySR and LLM-SR degrade significantly.
3. **Variability**:
- KeplerAgent shows the tightest interquartile range (IQR), indicating consistent performance.
- PySR and LLM-SR exhibit wider spreads, especially in noisy data.
4. **Logarithmic Scale Impact**:
- Differences in MSE are exaggerated on the log scale, highlighting KeplerAgent’s exponential advantage.
---
### Interpretation
The data demonstrates that **KeplerAgent** is the most effective method for ODE/PDE systems, outperforming PySR and LLM-SR by **orders of magnitude** in both clean and noisy scenarios. Its logarithmic MSE values suggest it handles system complexity and noise more efficiently, likely due to advanced algorithmic design or noise mitigation strategies. The tight IQR for KeplerAgent implies reliability, while PySR and LLM-SR show higher sensitivity to data quality. This analysis underscores the importance of method selection based on data fidelity in scientific computing tasks.