## Line Chart: Vocab Accuracy vs. Model Size
### Overview
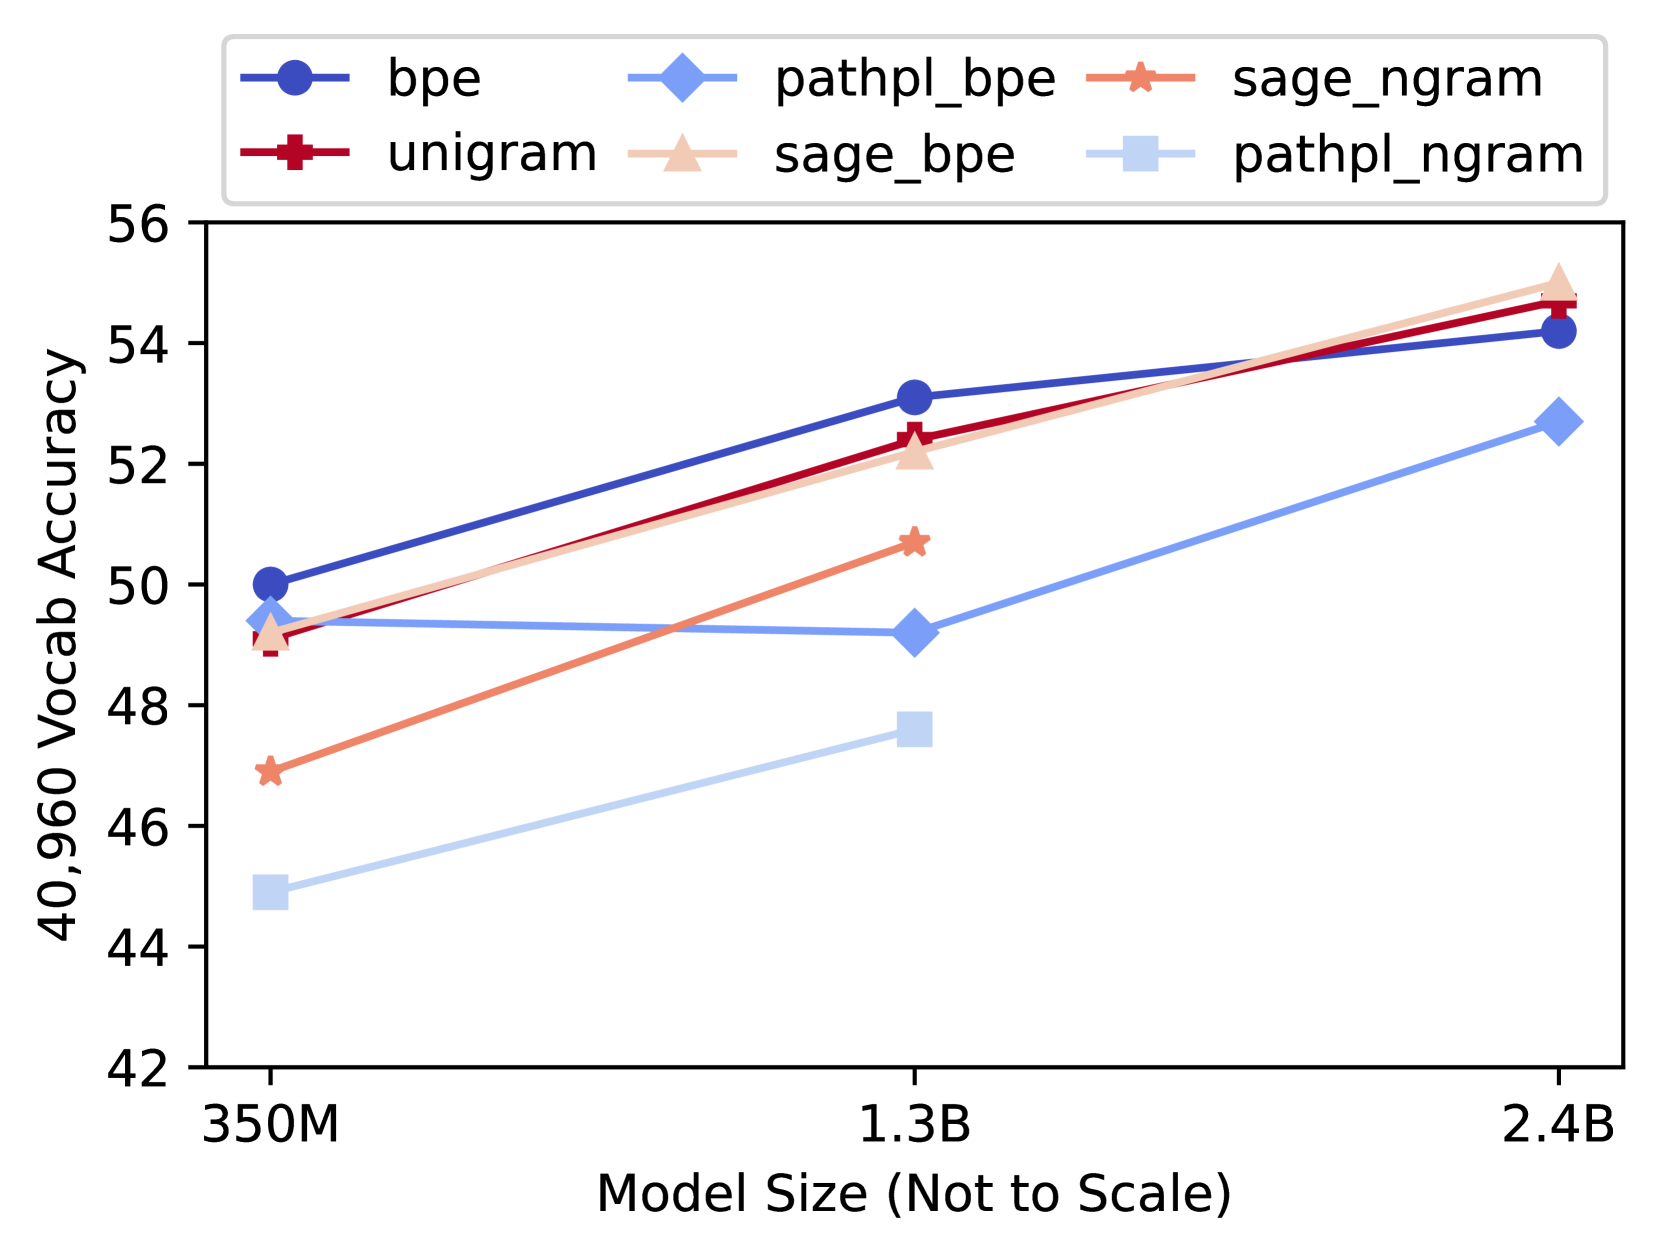
The image is a line chart comparing the vocabulary accuracy of different models against their size. The x-axis represents the model size (350M, 1.3B, 2.4B), and the y-axis represents the 40,960 vocab accuracy, ranging from 42 to 56. Six different models are compared, each represented by a different colored line with a unique marker.
### Components/Axes
* **Title:** There is no explicit title on the chart.
* **X-axis:** Model Size (Not to Scale)
* Values: 350M, 1.3B, 2.4B
* **Y-axis:** 40,960 Vocab Accuracy
* Values: 42, 44, 46, 48, 50, 52, 54, 56
* **Legend:** Located at the top of the chart.
* **bpe:** Dark blue line with circle markers.
* **unigram:** Dark red line with square markers.
* **pathpl\_bpe:** Light blue line with diamond markers.
* **sage\_bpe:** Light orange line with triangle markers.
* **sage\_ngram:** Light orange line with star markers.
* **pathpl\_ngram:** Light blue line with square markers.
### Detailed Analysis
* **bpe (Dark Blue, Circle):** The line slopes upward.
* 350M: ~50
* 1.3B: ~53
* 2.4B: ~54
* **unigram (Dark Red, Square):** The line slopes upward.
* 350M: ~49
* 1.3B: ~52
* 2.4B: ~55
* **pathpl\_bpe (Light Blue, Diamond):** The line slopes upward.
* 350M: ~50
* 1.3B: ~49
* 2.4B: ~53
* **sage\_bpe (Light Orange, Triangle):** The line slopes upward.
* 350M: ~49
* 1.3B: ~52
* 2.4B: ~55
* **sage\_ngram (Light Orange, Star):** The line slopes upward.
* 350M: ~47
* 1.3B: ~51
* 2.4B: ~55
* **pathpl\_ngram (Light Blue, Square):** The line slopes upward.
* 350M: ~45
* 1.3B: ~48
* 2.4B: ~55
### Key Observations
* The 'bpe' model (dark blue) and 'unigram' model (dark red) generally have higher vocabulary accuracy compared to the other models across all model sizes.
* The 'pathpl\_ngram' model (light blue square) has the lowest vocabulary accuracy at 350M and 1.3B, but its accuracy increases significantly at 2.4B, reaching a similar level to other models.
* All models show an increase in vocabulary accuracy as the model size increases from 350M to 2.4B.
* The models converge in accuracy as the model size increases to 2.4B.
### Interpretation
The chart demonstrates the relationship between model size and vocabulary accuracy for different models. The 'bpe' and 'unigram' models appear to be more effective in terms of vocabulary accuracy for smaller model sizes. However, as the model size increases, the performance of all models tends to converge, suggesting that increasing model size can compensate for differences in model architecture or training methods. The 'pathpl\_ngram' model's significant improvement at 2.4B suggests that this model benefits more from increased size compared to others. The note "Model Size (Not to Scale)" indicates that the distances between the model sizes on the x-axis are not proportional to the actual differences in size.