## Line Chart: 40,960 Vocab Accuracy vs Model Size
### Overview
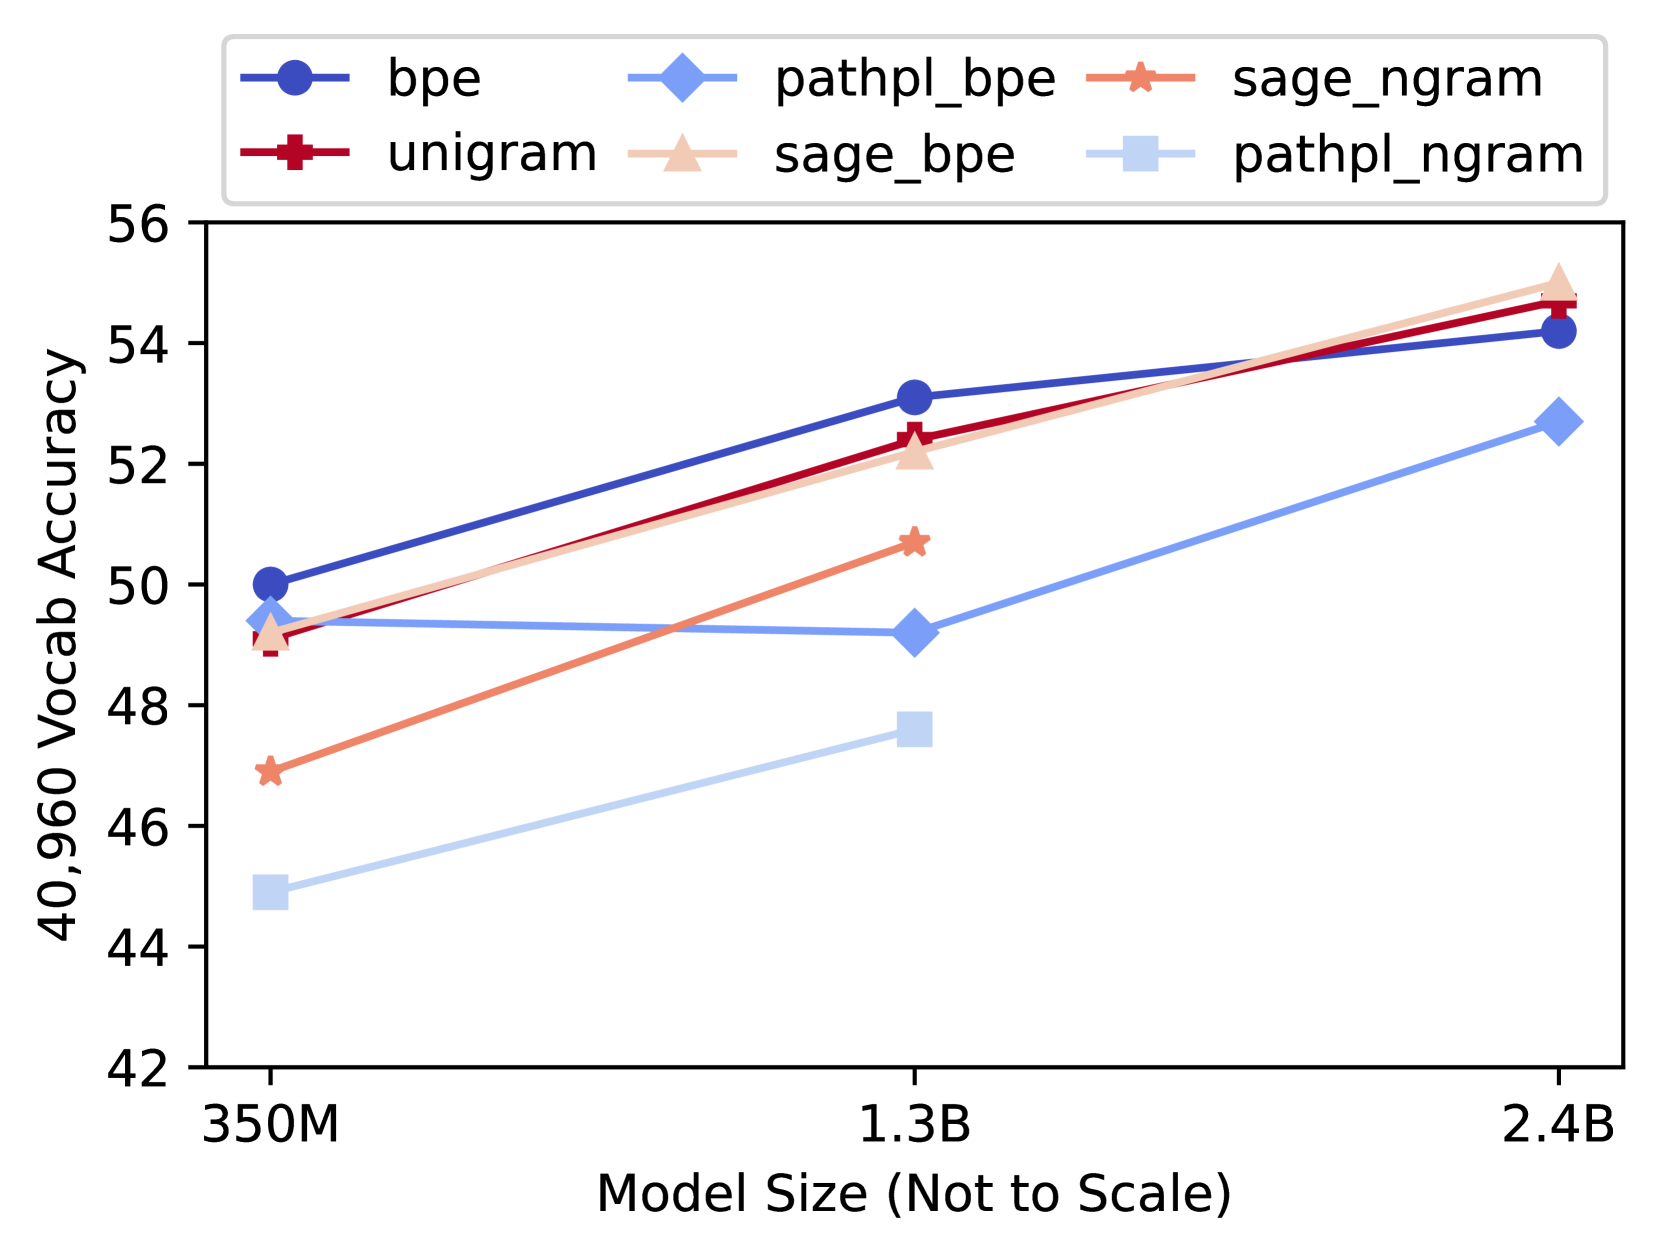
The chart compares the performance of six different model configurations (bpe, pathpl_bpe, sage_ngram, unigram, sage_bpe, pathpl_ngram) across three model sizes (350M, 1.3B, 2.4B) in terms of 40,960 Vocab Accuracy. Accuracy is measured on a scale from 42 to 56, with model sizes represented on a logarithmic scale.
### Components/Axes
- **X-axis**: Model Size (Not to Scale)
- Markers: 350M (left), 1.3B (center), 2.4B (right)
- **Y-axis**: 40,960 Vocab Accuracy (42–56)
- **Legend**: Top-left corner with six entries:
- Blue circle: bpe
- Light blue diamond: pathpl_bpe
- Orange star: sage_ngram
- Red cross: unigram
- Pink triangle: sage_bpe
- Light pink square: pathpl_ngram
### Detailed Analysis
1. **bpe (Blue Circle)**:
- 350M: ~50.0
- 1.3B: ~53.0
- 2.4B: ~54.2
- *Trend*: Steady upward slope.
2. **pathpl_bpe (Light Blue Diamond)**:
- 350M: ~49.5
- 1.3B: ~49.2
- 2.4B: ~52.8
- *Trend*: Flat initially, then sharp increase.
3. **sage_ngram (Orange Star)**:
- 350M: ~47.0
- 1.3B: ~50.5
- 2.4B: ~54.0
- *Trend*: Steep upward slope.
4. **unigram (Red Cross)**:
- 350M: ~49.0
- 1.3B: ~52.5
- 2.4B: ~54.5
- *Trend*: Sharp upward slope.
5. **sage_bpe (Pink Triangle)**:
- 350M: ~49.2
- 1.3B: ~52.0
- 2.4B: ~55.0
- *Trend*: Consistent upward slope.
6. **pathpl_ngram (Light Pink Square)**:
- 350M: ~45.0
- 1.3B: ~47.5
- 2.4B: ~52.5
- *Trend*: Gradual upward slope.
### Key Observations
- **Highest Performance**:
- At 2.4B, **sage_bpe** (55.0) and **unigram** (54.5) achieve the highest accuracy.
- **Lowest Performance**:
- **pathpl_ngram** (light pink square) consistently lags, with ~45.0 at 350M and ~52.5 at 2.4B.
- **Model Size Impact**:
- Larger models (2.4B) outperform smaller ones across all configurations.
- **sage_ngram** and **unigram** show the steepest improvement with model size.
- **Flat Lines**:
- **bpe** and **pathpl_bpe** exhibit relatively flat trends compared to others.
### Interpretation
The data suggests that model size significantly impacts performance, with larger models (2.4B) achieving higher accuracy. The **unigram** and **sage_ngram** configurations benefit most from increased model size, showing steep upward trends. In contrast, **pathpl_ngram** underperforms across all sizes, indicating potential inefficiencies in its design. The flat lines for **bpe** and **pathpl_bpe** imply that their performance is less sensitive to model size changes. This highlights the importance of architectural choices (e.g., n-gram vs. path-based models) in determining scalability and effectiveness.