## Line Charts: Zero-Shot Task Score vs. Ablated Head Numbers
### Overview
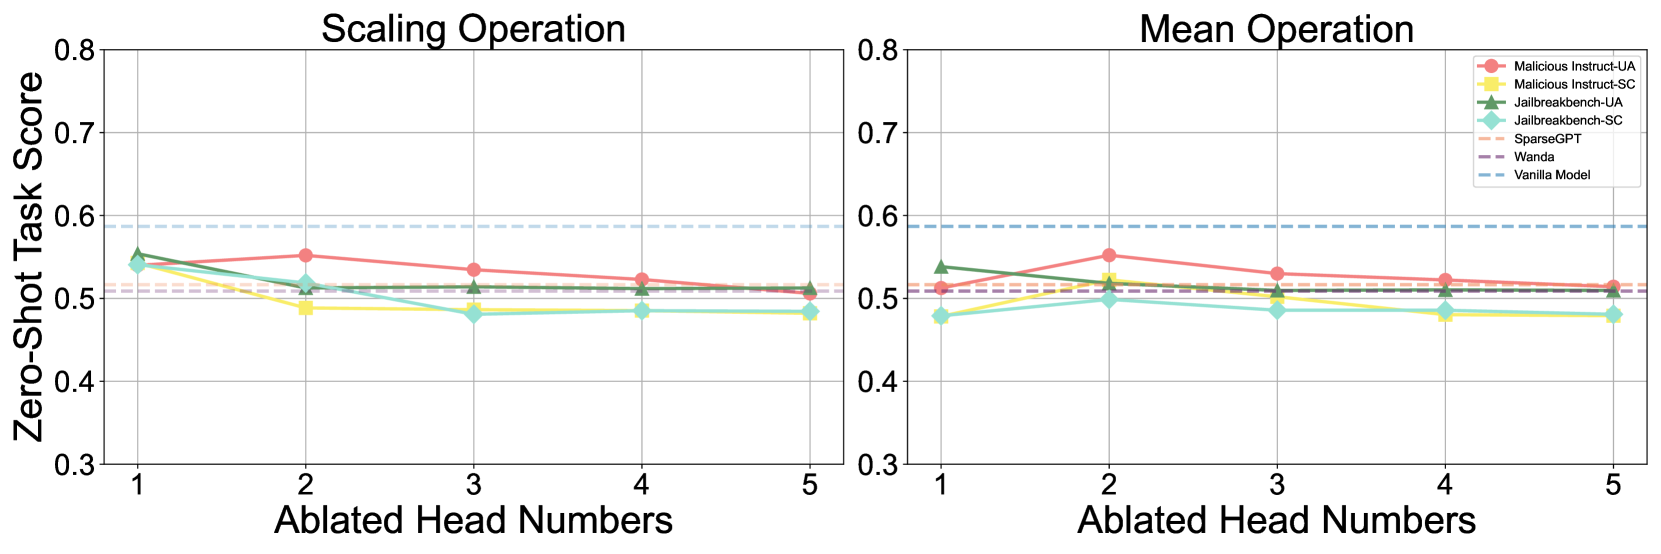
The image contains two line charts comparing zero-shot task scores across different ablated head numbers (1-5) for various models. The charts are titled "Scaling Operation" (left) and "Mean Operation" (right). Both charts share the same y-axis range (0.3-0.8) and x-axis labels (1-5 ablated heads). A legend identifies seven models with distinct colors.
### Components/Axes
- **X-axis**: "Ablated Head Numbers" (1-5)
- **Y-axis**: "Zero-Shot Task Score" (0.3-0.8)
- **Legend**:
- Malicious Instruct-UA (red)
- Malicious Instruct-SC (yellow)
- Jailbreakbench-UA (green)
- Jailbreakbench-SC (cyan)
- SparseGPT (orange)
- Wanda (purple)
- Vanilla Model (blue dashed line)
### Detailed Analysis
#### Scaling Operation Chart
- **Malicious Instruct-UA**: Starts at ~0.55 (head 1), declines to ~0.52 (head 5)
- **Malicious Instruct-SC**: Starts at ~0.52 (head 1), dips to ~0.49 (head 3), recovers to ~0.51 (head 5)
- **Jailbreakbench-UA**: Stable ~0.52-0.54 across all heads
- **Jailbreakbench-SC**: Starts at ~0.54 (head 1), declines to ~0.49 (head 3), recovers to ~0.51 (head 5)
- **SparseGPT**: Stable ~0.51-0.52 across all heads
- **Wanda**: Stable ~0.51-0.52 across all heads
- **Vanilla Model**: Constant dashed line at 0.6
#### Mean Operation Chart
- **Malicious Instruct-UA**: Starts at ~0.52 (head 1), peaks at ~0.56 (head 2), declines to ~0.53 (head 5)
- **Malicious Instruct-SC**: Starts at ~0.49 (head 1), peaks at ~0.53 (head 2), declines to ~0.49 (head 5)
- **Jailbreakbench-UA**: Starts at ~0.54 (head 1), declines to ~0.52 (head 5)
- **Jailbreakbench-SC**: Starts at ~0.51 (head 1), declines to ~0.49 (head 5)
- **SparseGPT**: Stable ~0.51-0.52 across all heads
- **Wanda**: Stable ~0.51-0.52 across all heads
- **Vanilla Model**: Constant dashed line at 0.6
### Key Observations
1. **Vanilla Model Dominance**: Maintains consistent 0.6 score in both operations, outperforming all ablated models.
2. **Scaling Operation Sensitivity**:
- Malicious Instruct-UA shows largest decline (-0.03)
- Jailbreakbench-SC has most pronounced dip (-0.05)
3. **Mean Operation Variability**:
- Malicious Instruct-UA shows initial improvement (+0.04) before decline
- Jailbreakbench-UA maintains highest stability (-0.02 total change)
4. **Color Consistency**: All legend colors match line colors exactly in both charts.
### Interpretation
The data suggests that:
- **Ablation Impact**: Scaling operations are more sensitive to head ablation than mean operations, with larger score drops observed.
- **Model Robustness**:
- Jailbreakbench-UA demonstrates best resilience in scaling operations
- Malicious Instruct-UA performs worst in scaling but shows temporary gains in mean operations
- **Vanilla Model Advantage**: Maintains superior performance across all ablation scenarios, indicating fundamental architectural advantages.
- **Operational Differences**: Mean operations show more recovery potential (e.g., Malicious Instruct-SC regains 0.02 points by head 5), while scaling operations show persistent deficits.
The consistent performance of the Vanilla Model across both operations highlights its architectural efficiency, while the varying impacts on different models suggest that head ablation affects different architectures through distinct mechanisms.