\n
## Diagram: Client Retention Prediction Flow
### Overview
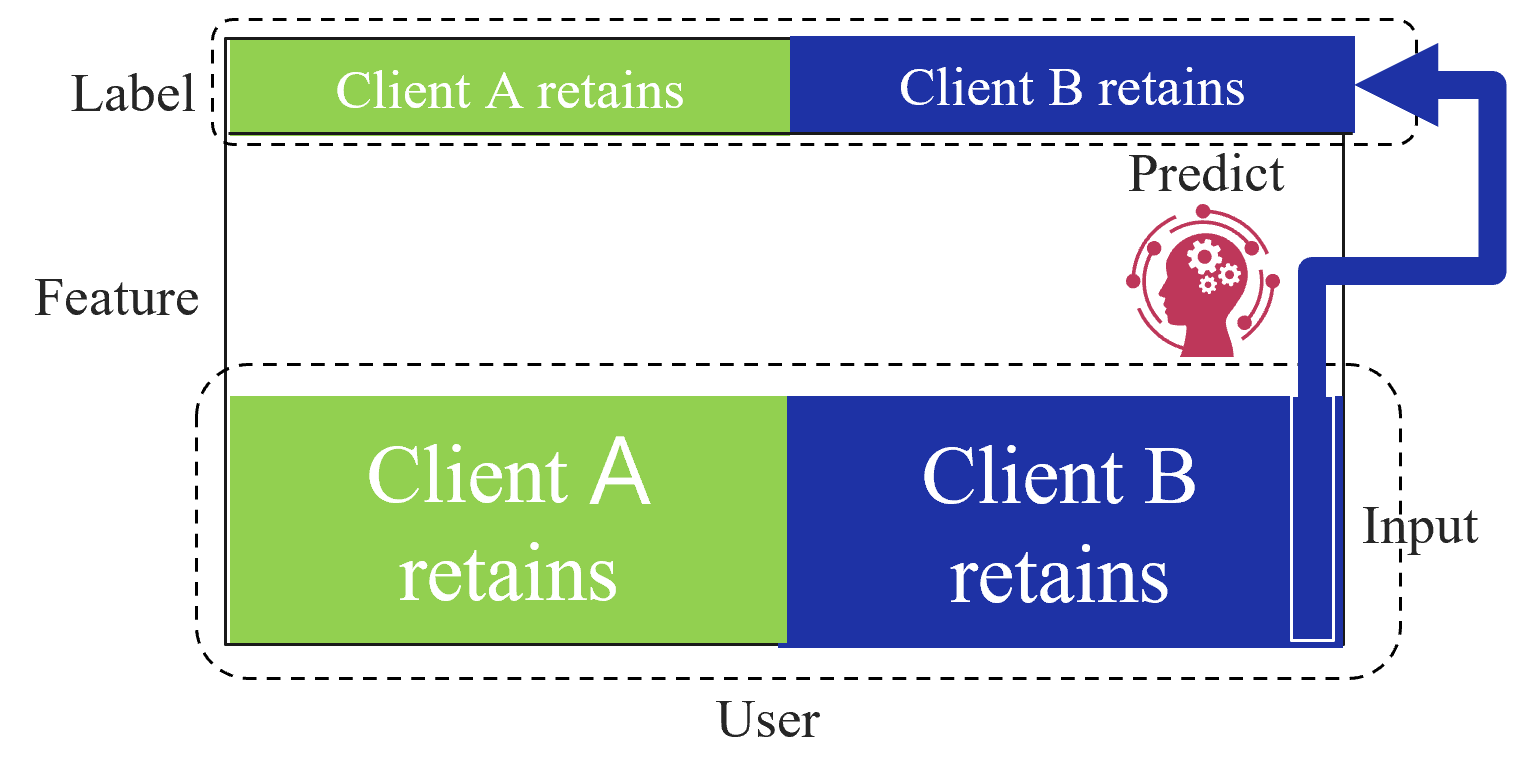
The image depicts a diagram illustrating a client retention prediction process. It shows an input stage, a prediction stage represented by a brain icon, and an output stage with labels indicating which client retains. The diagram is framed by dashed boxes and labeled axes.
### Components/Axes
The diagram has two primary axes:
* **Vertical Axis:** Labeled "Feature" at the left and "User" at the bottom.
* **Horizontal Axis:** Labeled "Label" at the top, with two categories: "Client A retains" and "Client B retains".
* **Input:** Indicated by text "Input" on the right side of the lower dashed box.
* **Predict:** Indicated by text "Predict" above the brain icon.
* **Arrow:** A large blue arrow points from the "Label" section towards the "Predict" stage.
* **Brain Icon:** A stylized brain icon with gears inside, representing the prediction process.
* **Text Blocks:** Two text blocks within the lower dashed box: "Client A retains" (green background) and "Client B retains" (blue background).
### Detailed Analysis
The diagram shows a flow of information. The "User" provides a "Feature" as input. This input is then processed by the "Predict" stage (the brain icon). The output of the prediction is a "Label" indicating whether "Client A retains" or "Client B retains".
The lower dashed box contains the input data, visually separated into two categories:
* **Client A retains:** Displayed on a green background.
* **Client B retains:** Displayed on a blue background.
The upper section, labeled "Label", represents the predicted outcome. The arrow indicates the direction of the prediction process.
### Key Observations
The diagram is a simplified representation of a machine learning or predictive modeling process. It highlights the input features, the prediction stage, and the resulting label. The color coding (green for Client A, blue for Client B) suggests a binary classification problem. The diagram does not contain any numerical data or specific values. It is a conceptual illustration of a process.
### Interpretation
This diagram illustrates a supervised learning scenario where the goal is to predict client retention. The "Feature" represents the data used to make the prediction (e.g., customer demographics, purchase history, engagement metrics). The "Predict" stage represents the model that learns from this data. The "Label" represents the actual outcome (which client retained). The diagram suggests a process where the model takes the "Feature" as input and outputs a prediction about which client will retain. The arrow indicates the flow of information from the input to the prediction. The diagram is a high-level overview and does not provide details about the specific model or features used. It is a conceptual illustration of a client retention prediction process.