## Scatter Plot Matrix: Fraction of Variance Explained by PCs
### Overview
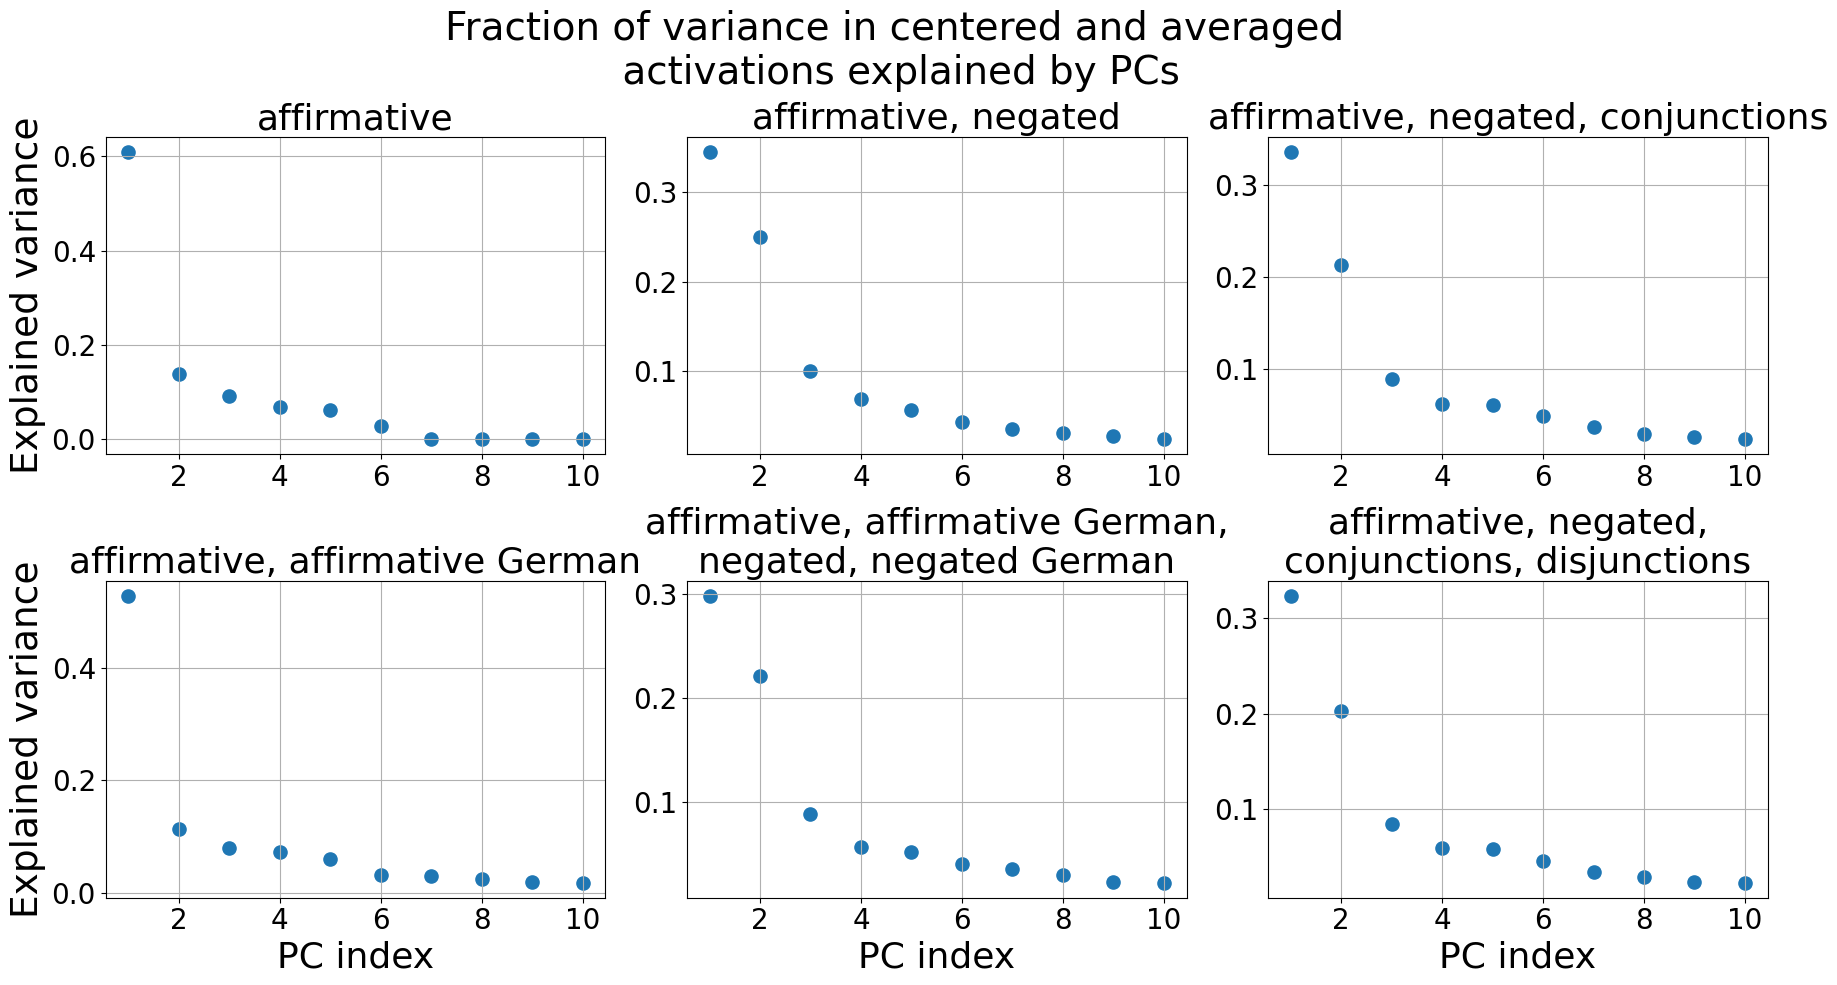
The image presents a 2x3 matrix of scatter plots. Each plot shows the fraction of variance explained by principal components (PCs) for different conditions related to sentence structure and language. The x-axis represents the PC index (from 1 to 10), and the y-axis represents the explained variance. All plots show a decreasing trend, indicating that the first few PCs explain most of the variance.
### Components/Axes
* **Title:** Fraction of variance in centered and averaged activations explained by PCs
* **X-axis (all plots):** PC index, with ticks at 2, 4, 6, 8, and 10.
* **Y-axis (left column plots):** Explained variance, with ticks at 0.0, 0.2, 0.4, and 0.6.
* **Y-axis (center and right column plots):** Explained variance, with ticks at 0.0, 0.1, 0.2, and 0.3.
* **Plot Titles (from left to right, top to bottom):**
* affirmative
* affirmative, negated
* affirmative, negated, conjunctions
* affirmative, affirmative German
* affirmative, affirmative German, negated, negated German
* affirmative, negated, conjunctions, disjunctions
### Detailed Analysis
**Plot 1: affirmative**
* Trend: Decreasing. The explained variance drops sharply from PC 1 to PC 2, then decreases more gradually.
* Data Points:
* PC 1: ~0.61
* PC 2: ~0.14
* PC 3: ~0.09
* PC 4: ~0.07
* PC 5: ~0.06
* PC 6: ~0.03
* PC 7: ~0.01
* PC 8: ~0.00
* PC 9: ~0.00
* PC 10: ~0.00
**Plot 2: affirmative, negated**
* Trend: Decreasing. Similar to Plot 1, but with lower overall variance explained.
* Data Points:
* PC 1: ~0.25
* PC 2: ~0.11
* PC 3: ~0.07
* PC 4: ~0.04
* PC 5: ~0.03
* PC 6: ~0.02
* PC 7: ~0.02
* PC 8: ~0.02
* PC 9: ~0.02
* PC 10: ~0.02
**Plot 3: affirmative, negated, conjunctions**
* Trend: Decreasing.
* Data Points:
* PC 1: ~0.33
* PC 2: ~0.22
* PC 3: ~0.09
* PC 4: ~0.06
* PC 5: ~0.06
* PC 6: ~0.05
* PC 7: ~0.03
* PC 8: ~0.03
* PC 9: ~0.02
* PC 10: ~0.02
**Plot 4: affirmative, affirmative German**
* Trend: Decreasing.
* Data Points:
* PC 1: ~0.47
* PC 2: ~0.11
* PC 3: ~0.07
* PC 4: ~0.07
* PC 5: ~0.05
* PC 6: ~0.03
* PC 7: ~0.03
* PC 8: ~0.02
* PC 9: ~0.02
* PC 10: ~0.02
**Plot 5: affirmative, affirmative German, negated, negated German**
* Trend: Decreasing.
* Data Points:
* PC 1: ~0.29
* PC 2: ~0.22
* PC 3: ~0.09
* PC 4: ~0.06
* PC 5: ~0.05
* PC 6: ~0.03
* PC 7: ~0.03
* PC 8: ~0.02
* PC 9: ~0.02
* PC 10: ~0.02
**Plot 6: affirmative, negated, conjunctions, disjunctions**
* Trend: Decreasing.
* Data Points:
* PC 1: ~0.32
* PC 2: ~0.20
* PC 3: ~0.08
* PC 4: ~0.06
* PC 5: ~0.05
* PC 6: ~0.03
* PC 7: ~0.03
* PC 8: ~0.02
* PC 9: ~0.02
* PC 10: ~0.02
### Key Observations
* In all plots, the first principal component (PC 1) explains the largest fraction of variance.
* The explained variance decreases rapidly from PC 1 to PC 2, and then decreases more gradually for higher PCs.
* The "affirmative" condition (Plot 1) has the highest explained variance by PC 1 compared to the other conditions.
* The inclusion of negation, conjunctions, and disjunctions generally reduces the fraction of variance explained by the first few PCs.
* The inclusion of German language sentences also appears to reduce the fraction of variance explained by the first few PCs.
### Interpretation
The plots demonstrate how different linguistic structures and the inclusion of another language (German) affect the distribution of variance across principal components in neural activations. The fact that the first few PCs explain most of the variance suggests that there are dominant patterns in the neural activations that are captured by these components. The differences in explained variance across conditions indicate that different linguistic structures and languages lead to different patterns of neural activity. The "affirmative" condition, being the simplest, has the most variance explained by the first PC, suggesting a more consistent neural representation. The addition of negation, conjunctions, disjunctions, and another language introduces more complexity and variability, leading to a lower fraction of variance explained by the first few PCs. This implies that more PCs are needed to capture the full complexity of the neural representations for these more complex conditions.