\n
## Scatter Plots: Fraction of Variance Explained by PCs
### Overview
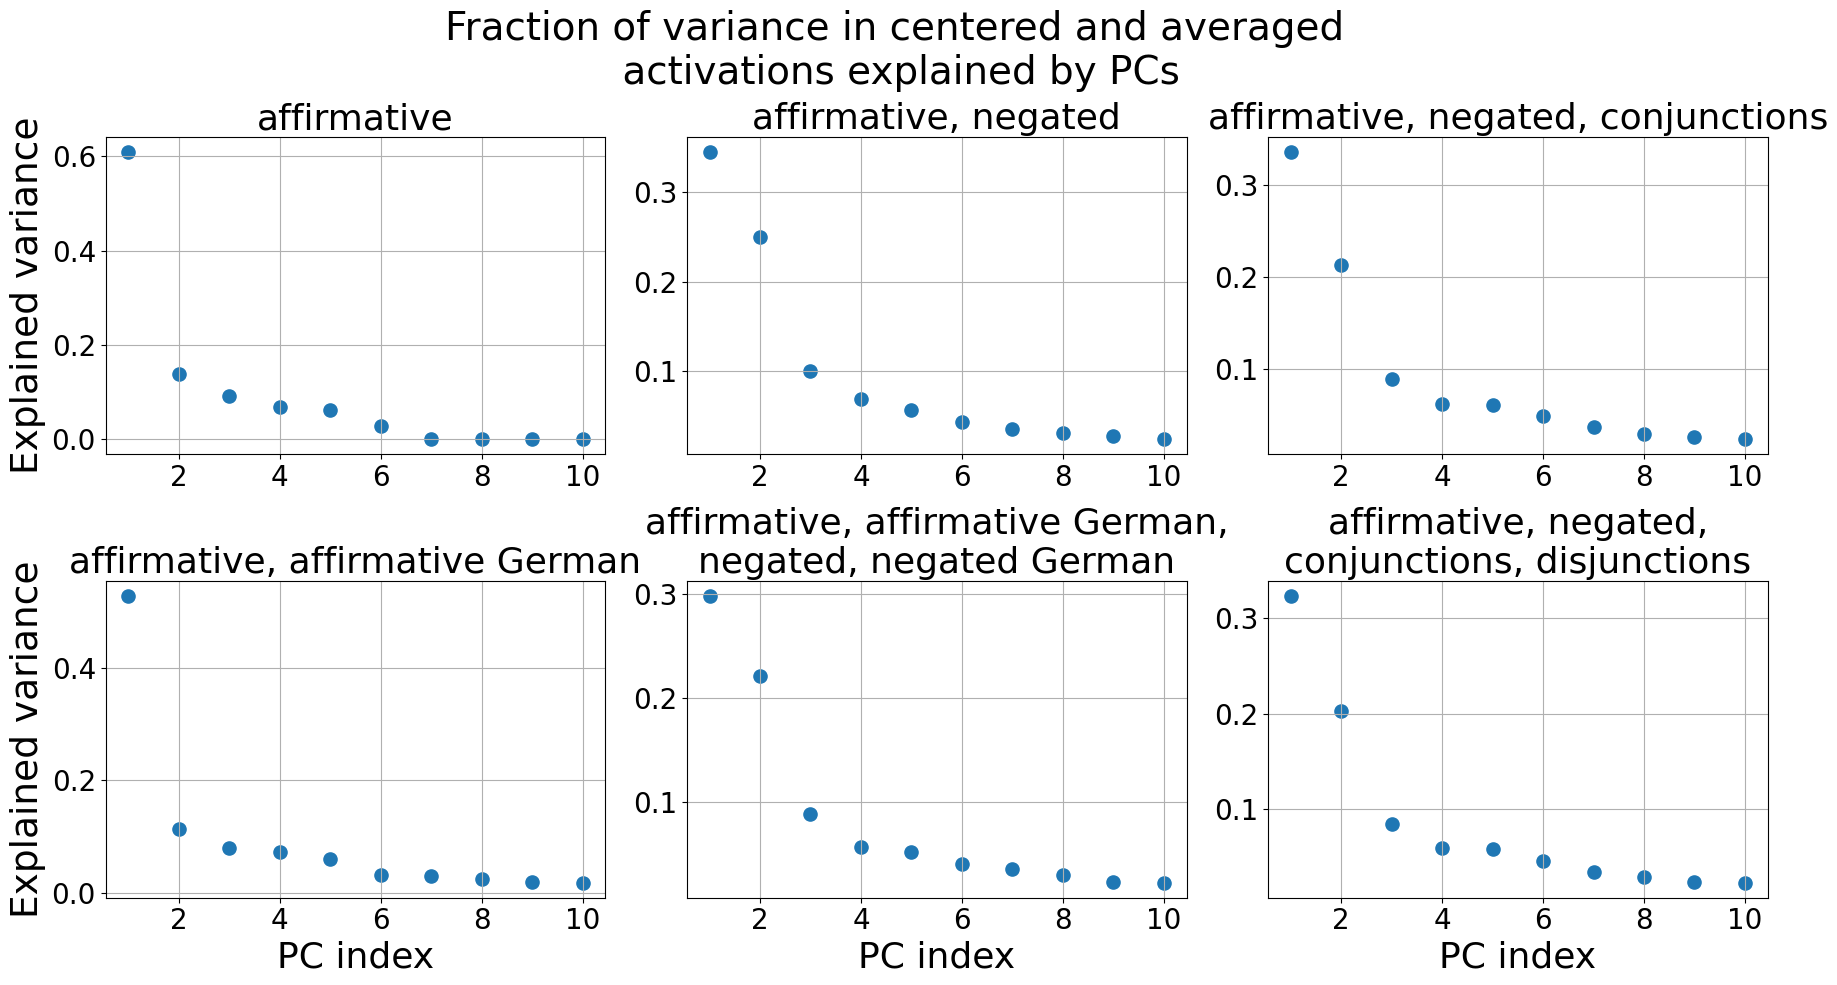
The image presents six scatter plots, each representing the fraction of variance in centered and averaged activations explained by Principal Components (PCs). Each plot corresponds to a different linguistic condition. The x-axis represents the PC index (ranging from 1 to 10), and the y-axis represents the explained variance (ranging from 0 to approximately 0.6).
### Components/Axes
* **Title:** "Fraction of variance in centered and averaged activations explained by PCs" (centered at the top)
* **X-axis Label:** "PC index" (appears on the bottom of each plot)
* **Y-axis Label:** "Explained variance" (appears on the left side of each plot)
* **Plots (arranged in a 2x3 grid):**
1. "affirmative"
2. "affirmative, negated"
3. "affirmative, negated, conjunctions"
4. "affirmative, affirmative German, negated, negated German"
5. "affirmative, affirmative German"
6. "affirmative, negated, conjunctions, disjunctions"
### Detailed Analysis or Content Details
**Plot 1: "affirmative"**
* Trend: The explained variance starts high at PC index 1 and rapidly decreases, leveling off near zero for PC indices 3-10.
* Data Points (approximate):
* PC 1: 0.6
* PC 2: 0.1
* PC 3: 0.05
* PC 4: 0.03
* PC 5: 0.02
* PC 6: 0.01
* PC 7: 0.01
* PC 8: 0.01
* PC 9: 0.01
* PC 10: 0.01
**Plot 2: "affirmative, negated"**
* Trend: Similar to Plot 1, but with lower overall explained variance. Starts at a lower value and decreases more rapidly.
* Data Points (approximate):
* PC 1: 0.3
* PC 2: 0.15
* PC 3: 0.07
* PC 4: 0.04
* PC 5: 0.02
* PC 6: 0.01
* PC 7: 0.01
* PC 8: 0.01
* PC 9: 0.01
* PC 10: 0.01
**Plot 3: "affirmative, negated, conjunctions"**
* Trend: Similar to Plot 2, with slightly lower variance.
* Data Points (approximate):
* PC 1: 0.25
* PC 2: 0.12
* PC 3: 0.06
* PC 4: 0.04
* PC 5: 0.02
* PC 6: 0.01
* PC 7: 0.01
* PC 8: 0.01
* PC 9: 0.01
* PC 10: 0.01
**Plot 4: "affirmative, affirmative German, negated, negated German"**
* Trend: Similar to Plot 1, but with lower overall explained variance.
* Data Points (approximate):
* PC 1: 0.4
* PC 2: 0.18
* PC 3: 0.06
* PC 4: 0.04
* PC 5: 0.02
* PC 6: 0.01
* PC 7: 0.01
* PC 8: 0.01
* PC 9: 0.01
* PC 10: 0.01
**Plot 5: "affirmative, affirmative German"**
* Trend: Similar to Plot 1, but with lower overall explained variance.
* Data Points (approximate):
* PC 1: 0.4
* PC 2: 0.15
* PC 3: 0.05
* PC 4: 0.03
* PC 5: 0.02
* PC 6: 0.01
* PC 7: 0.01
* PC 8: 0.01
* PC 9: 0.01
* PC 10: 0.01
**Plot 6: "affirmative, negated, conjunctions, disjunctions"**
* Trend: Similar to Plot 2 and 3, with slightly lower variance.
* Data Points (approximate):
* PC 1: 0.2
* PC 2: 0.1
* PC 3: 0.05
* PC 4: 0.03
* PC 5: 0.02
* PC 6: 0.01
* PC 7: 0.01
* PC 8: 0.01
* PC 9: 0.01
* PC 10: 0.01
### Key Observations
* The "affirmative" condition consistently explains the most variance with the first PC.
* Adding negation, conjunctions, disjunctions, and German language elements generally reduces the explained variance, particularly for the first PC.
* For all conditions, the explained variance drops off rapidly after the first few PCs, indicating that a small number of PCs capture most of the variance.
* The variance explained by PCs 7-10 is minimal across all conditions.
### Interpretation
The data suggests that the linguistic condition significantly impacts the variance explained by the principal components. The "affirmative" condition, being the simplest, is best captured by the first PC, indicating a strong underlying structure. As linguistic complexity increases (through negation, conjunctions, disjunctions, and the inclusion of another language), the variance explained by the first PC decreases, suggesting that more PCs are needed to adequately represent the data. This implies that more complex linguistic structures require a more nuanced representation in terms of principal components. The rapid drop-off in explained variance after the first few PCs suggests that the underlying dimensionality of the data is relatively low, even for the more complex conditions. The inclusion of German does not appear to drastically alter the overall trend, but does contribute to a reduction in explained variance compared to the purely English conditions. This could indicate subtle differences in the underlying representations of these linguistic structures across languages.