## [Chart Type]: Scatter Plot Grid (Explained Variance by Principal Component)
### Overview
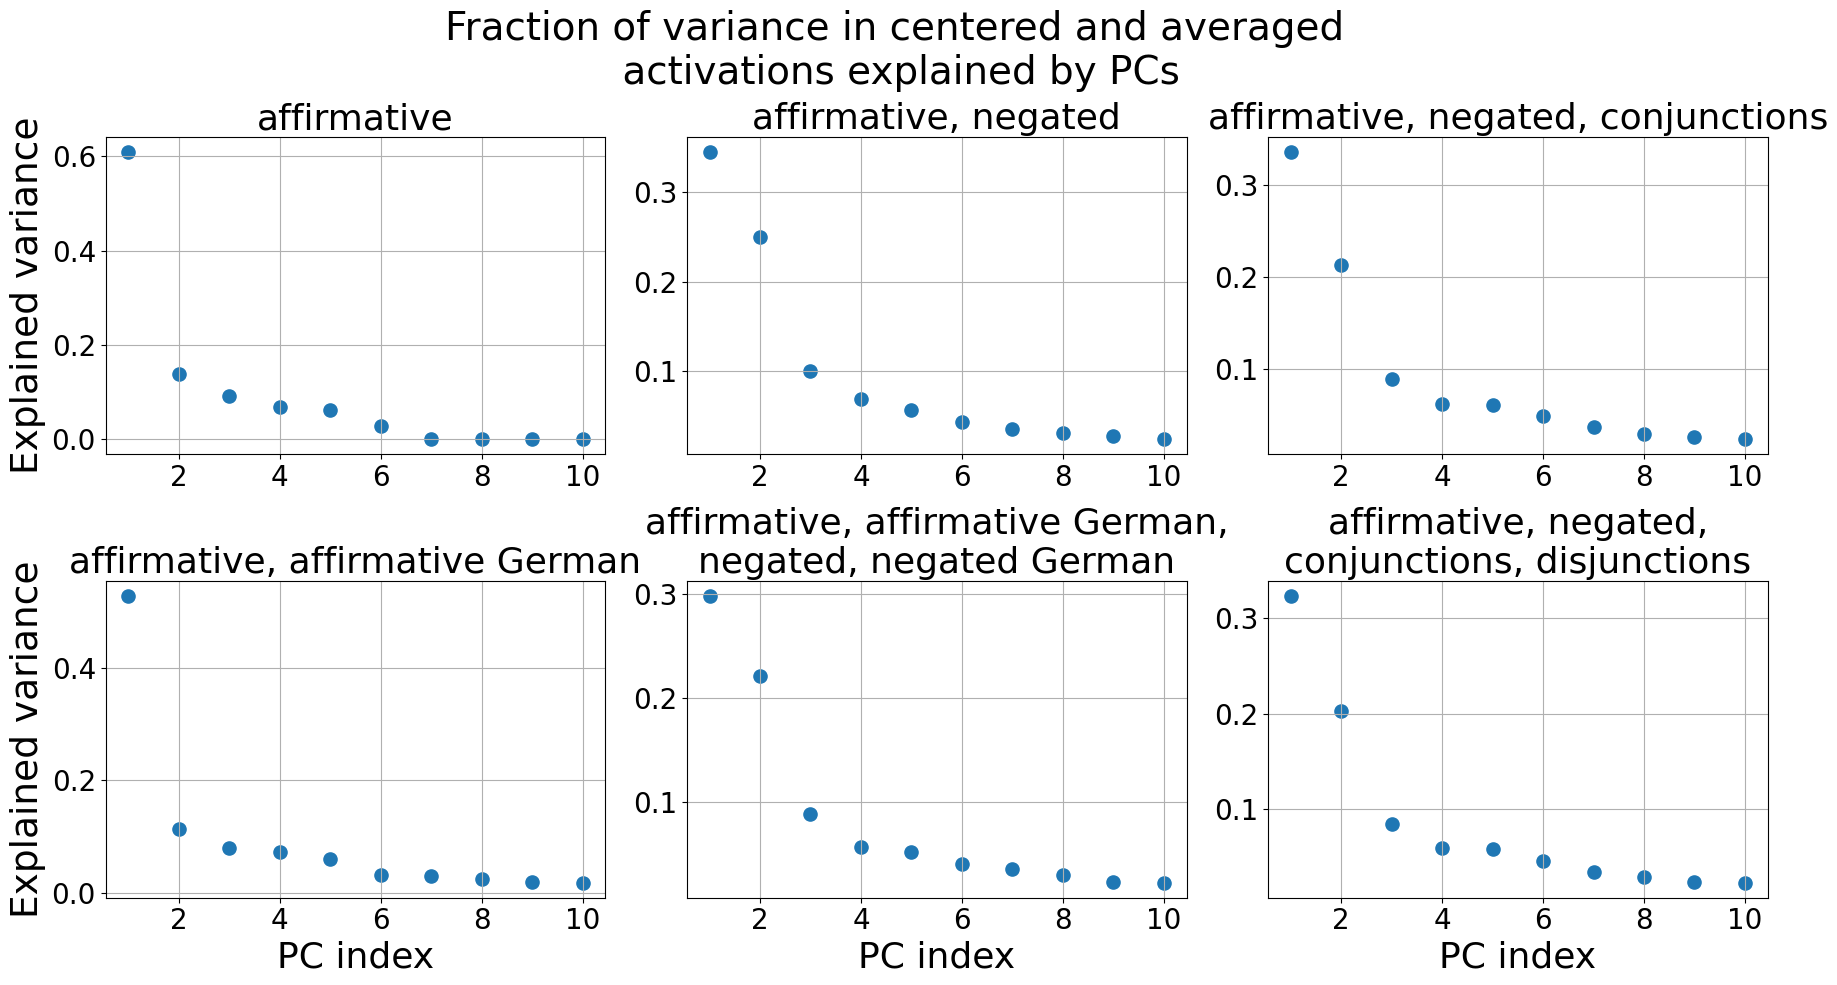
The image displays a 2x3 grid of six scatter plots under the main title: **"Fraction of variance in centered and averaged activations explained by PCs"**. Each subplot shows the explained variance (y-axis) for the first 10 principal components (PCs, x-axis) for different combinations of linguistic conditions. The plots collectively analyze how variance in activation patterns is distributed across principal components for various datasets.
### Components/Axes
* **Main Title:** "Fraction of variance in centered and averaged activations explained by PCs" (Top center).
* **Subplot Titles (Top Row, Left to Right):**
1. "affirmative"
2. "affirmative, negated"
3. "affirmative, negated, conjunctions"
* **Subplot Titles (Bottom Row, Left to Right):**
1. "affirmative, affirmative German"
2. "affirmative, affirmative German, negated, negated German"
3. "affirmative, negated, conjunctions, disjunctions"
* **Axes:**
* **X-axis (All plots):** "PC index" (labeled explicitly on bottom row plots). Ticks are at 2, 4, 6, 8, 10. The data points correspond to PC indices 1 through 10.
* **Y-axis (Leftmost plots of each row):** "Explained variance". The scale varies between subplots.
* **Data Series:** Each plot contains a single series of blue circular data points, one for each PC index from 1 to 10.
### Detailed Analysis
**Trend Verification:** In all six plots, the data series follows the same fundamental trend: a steep, monotonic decline from the first PC to the second, followed by a more gradual decay, approaching zero by the 10th PC. This is a classic "scree plot" pattern.
**Subplot-by-Subplot Data Points (Approximate Values):**
1. **Top-Left: "affirmative"**
* Y-axis scale: 0.0 to 0.6.
* PC 1: ~0.61
* PC 2: ~0.14
* PC 3: ~0.09
* PC 4: ~0.07
* PC 5: ~0.06
* PC 6: ~0.03
* PCs 7-10: ~0.01 or less.
2. **Top-Middle: "affirmative, negated"**
* Y-axis scale: 0.0 to 0.35.
* PC 1: ~0.35
* PC 2: ~0.25
* PC 3: ~0.10
* PC 4: ~0.07
* PC 5: ~0.06
* PC 6: ~0.04
* PCs 7-10: ~0.03 or less.
3. **Top-Right: "affirmative, negated, conjunctions"**
* Y-axis scale: 0.0 to 0.35.
* PC 1: ~0.33
* PC 2: ~0.21
* PC 3: ~0.09
* PC 4: ~0.07
* PC 5: ~0.07
* PC 6: ~0.05
* PCs 7-10: ~0.04 or less.
4. **Bottom-Left: "affirmative, affirmative German"**
* Y-axis scale: 0.0 to 0.5.
* PC 1: ~0.50
* PC 2: ~0.11
* PC 3: ~0.08
* PC 4: ~0.07
* PC 5: ~0.06
* PC 6: ~0.03
* PCs 7-10: ~0.02 or less.
5. **Bottom-Middle: "affirmative, affirmative German, negated, negated German"**
* Y-axis scale: 0.0 to 0.3.
* PC 1: ~0.30
* PC 2: ~0.22
* PC 3: ~0.09
* PC 4: ~0.06
* PC 5: ~0.05
* PC 6: ~0.04
* PCs 7-10: ~0.03 or less.
6. **Bottom-Right: "affirmative, negated, conjunctions, disjunctions"**
* Y-axis scale: 0.0 to 0.35.
* PC 1: ~0.32
* PC 2: ~0.20
* PC 3: ~0.09
* PC 4: ~0.07
* PC 5: ~0.07
* PC 6: ~0.05
* PCs 7-10: ~0.04 or less.
### Key Observations
1. **Dominance of First PC:** In every dataset, the first principal component (PC1) explains a significantly larger fraction of the variance than any subsequent component. The drop from PC1 to PC2 is the most dramatic feature in all plots.
2. **Dataset Complexity vs. Explained Variance:** The "affirmative" only dataset (top-left) shows the highest explained variance for PC1 (~0.61). As more conditions are added (negations, conjunctions, German translations, disjunctions), the explained variance for PC1 decreases, generally falling into the 0.30-0.35 range. This suggests the variance becomes more distributed across components as the data becomes more complex.
3. **Similar Decay Patterns:** Despite different starting points, the shape of the decay curve is remarkably consistent across all six conditions, indicating a common underlying structure in the activation data.
4. **Language Effect:** Comparing "affirmative" (PC1 ~0.61) with "affirmative, affirmative German" (PC1 ~0.50) suggests that adding cross-linguistic data reduces the dominance of the first PC, spreading variance more evenly.
### Interpretation
This figure presents a principal component analysis (PCA) of activation patterns from a computational model, likely a neural network processing language. The "centered and averaged activations" suggest the data represents mean responses to specific linguistic stimuli.
The key finding is that a single dominant direction of variation (PC1) captures a large portion of the variance in the model's internal representations, especially for simple affirmative statements. This PC1 likely corresponds to a core semantic or syntactic feature. The rapid drop-off indicates that subsequent components capture increasingly finer-grained or idiosyncratic variations.
The decrease in PC1's explained variance when more diverse conditions are included (negations, other languages, logical connectives) implies that these additional phenomena introduce new, independent axes of variation into the model's representation space. The consistent scree plot shape across all conditions suggests a robust, low-dimensional structure in how the model encodes these linguistic concepts, with the first few dimensions being sufficient to explain the majority of the systematic variance. This is evidence for the model developing efficient, compositional representations.