## Scatter Plot Grid: Fraction of Variance in Centered and Averaged Activations Explained by PCs
### Overview
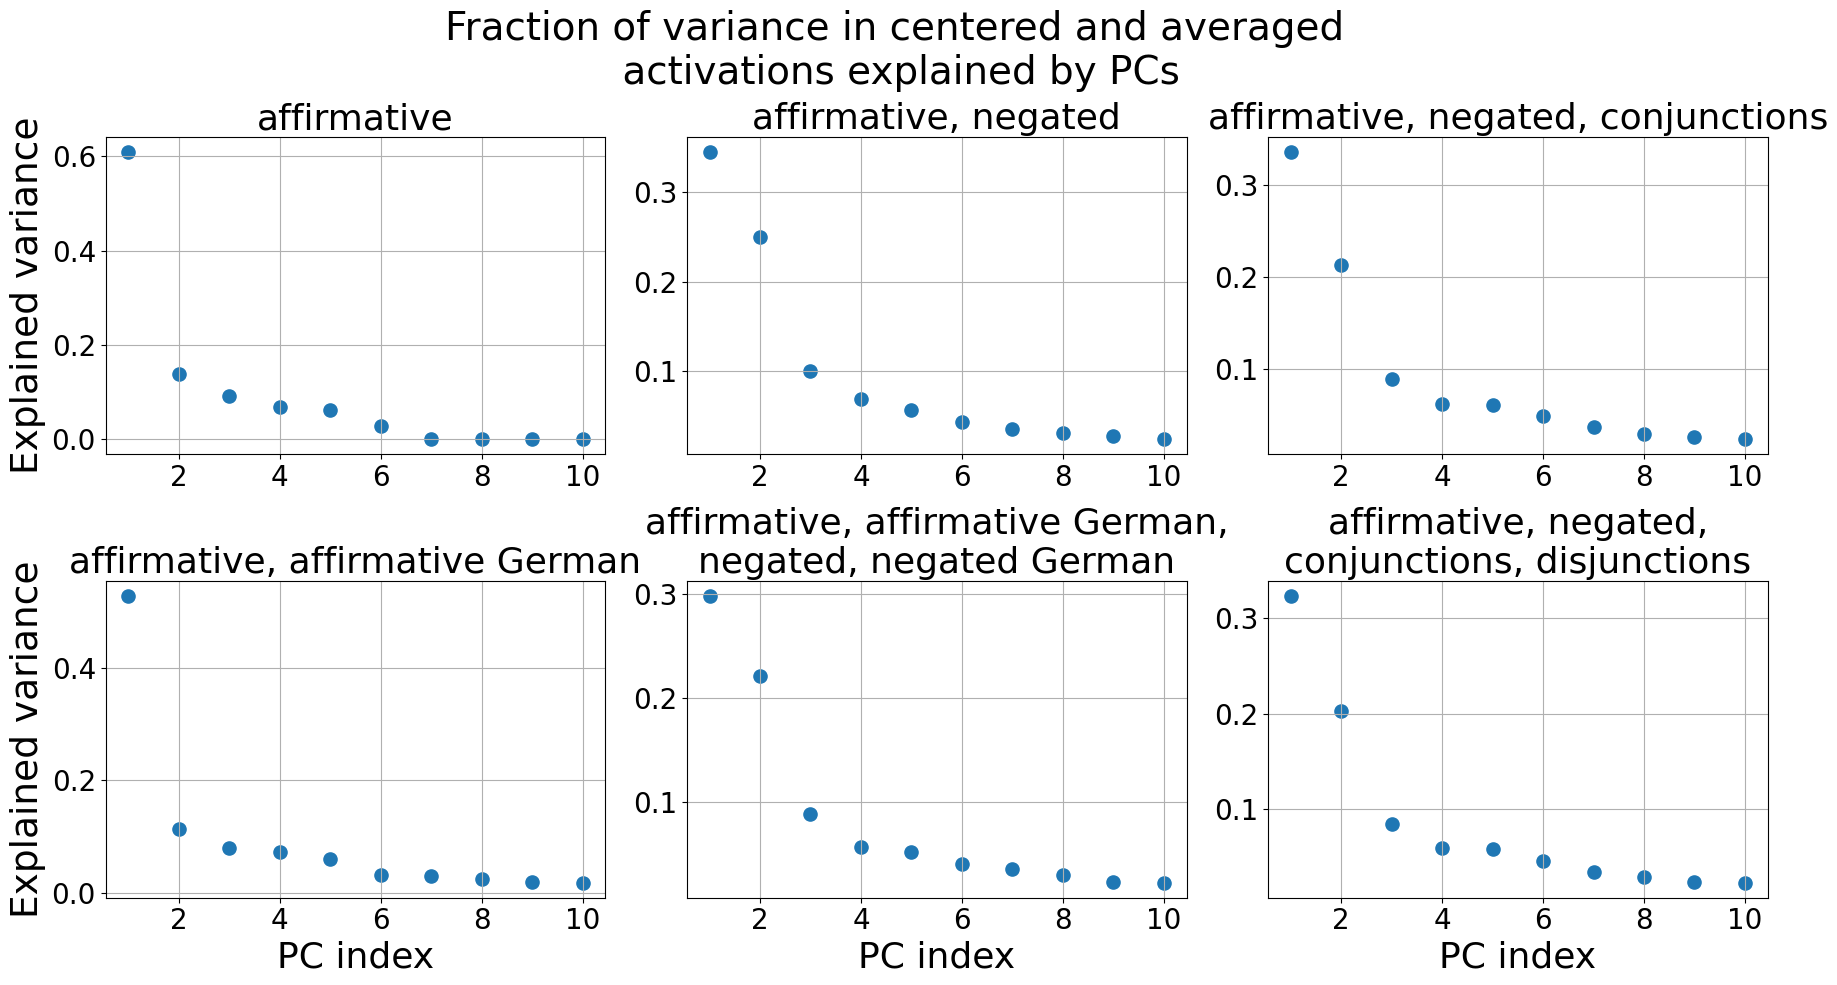
The image contains six scatter plots arranged in a 2x3 grid, each visualizing the relationship between principal component (PC) index and explained variance for different linguistic conditions. All plots share identical axes but vary in their experimental conditions, as indicated by their titles. Data points are consistently blue across all plots.
### Components/Axes
- **X-axis**: "PC index" (ranges from 2 to 10 in all plots)
- **Y-axis**: "Explained variance" (ranges from 0 to 0.6 in all plots)
- **Legend**: Positioned at the top-right of the grid, labeled "affirmative" (blue color). No other legend entries are visible, suggesting all data points share the same color coding.
- **Plot Titles** (top to bottom, left to right):
1. "affirmative"
2. "affirmative, negated"
3. "affirmative, negated, conjunctions"
4. "affirmative, affirmative German"
5. "affirmative, affirmative German, negated, negated German"
6. "affirmative, negated, conjunctions, disjunctions"
### Detailed Analysis
#### Top Row
1. **Affirmative**
- **Trend**: Sharp decline in explained variance.
- **Data Points**:
- PC 2: ~0.6
- PC 3: ~0.15
- PC 4–10: ~0.02–0.05
2. **Affirmative, Negated**
- **Trend**: Gradual decline.
- **Data Points**:
- PC 2: ~0.3
- PC 3: ~0.1
- PC 4–10: ~0.03–0.07
3. **Affirmative, Negated, Conjunctions**
- **Trend**: Steeper initial drop, then gradual decline.
- **Data Points**:
- PC 2: ~0.3
- PC 3: ~0.1
- PC 4: ~0.05
- PC 5–10: ~0.02–0.04
#### Bottom Row
4. **Affirmative, Affirmative German**
- **Trend**: Rapid initial drop, then plateau.
- **Data Points**:
- PC 2: ~0.45
- PC 3: ~0.1
- PC 4–10: ~0.02–0.05
5. **Affirmative, Affirmative German, Negated, Negated German**
- **Trend**: Moderate decline.
- **Data Points**:
- PC 2: ~0.3
- PC 3: ~0.1
- PC 4–10: ~0.03–0.06
6. **Affirmative, Negated, Conjunctions, Disjunctions**
- **Trend**: Steady decline.
- **Data Points**:
- PC 2: ~0.3
- PC 3: ~0.1
- PC 4: ~0.07
- PC 5–10: ~0.03–0.05
### Key Observations
- **Highest Variance**: The "affirmative" condition explains the most variance in PC 2 (~0.6), far exceeding other conditions.
- **Complexity Correlation**: Conditions with additional modifiers (e.g., negations, conjunctions) show lower initial variance explained.
- **Consistent Decay**: All plots exhibit a general decline in explained variance as PC index increases, with steeper drops in simpler conditions.
- **German-Specific Effects**: The "affirmative German" condition retains higher variance in PC 2 (~0.45) compared to non-German conditions.
### Interpretation
The data suggests that simpler linguistic conditions (e.g., "affirmative") dominate the variance explained by the first few principal components. Adding complexity (negations, conjunctions, or German-specific terms) reduces the variance attributed to early PCs, indicating that higher-order PCs capture more nuanced or condition-specific patterns. The German-specific conditions ("affirmative German") retain slightly higher variance in PC 2, implying linguistic differences may influence activation patterns. The consistent decay across all plots highlights that early PCs generally capture broad, shared features, while later PCs encode finer distinctions.