\n
## Chart: Accuracy vs. Sample Size
### Overview
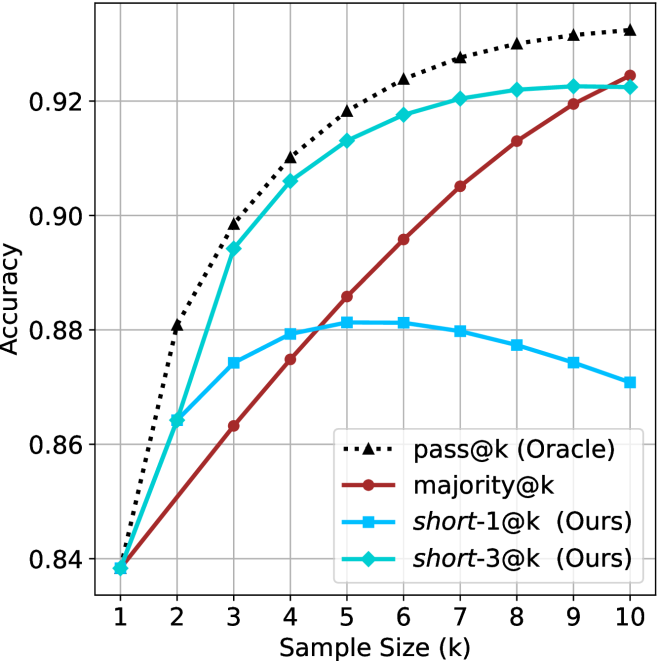
The image presents a line chart comparing the accuracy of four different methods – pass@k (Oracle), majority@k, short-1@k (Ours), and short-3@k (Ours) – as a function of sample size (k). The chart illustrates how the performance of each method changes as the number of samples considered increases.
### Components/Axes
* **X-axis:** Sample Size (k), ranging from 1 to 10.
* **Y-axis:** Accuracy, ranging from 0.84 to 0.93.
* **Legend:** Located in the bottom-right corner, identifying the four data series:
* pass@k (Oracle) - represented by a black dotted line with triangle markers.
* majority@k - represented by a maroon solid line with circle markers.
* short-1@k (Ours) - represented by a blue solid line with circle markers.
* short-3@k (Ours) - represented by a teal solid line with circle markers.
* **Gridlines:** A light gray grid is present to aid in reading values.
### Detailed Analysis
Here's a breakdown of each line's trend and approximate data points:
* **pass@k (Oracle):** This line (black dotted) shows a rapidly increasing accuracy from k=1 to k=4, then plateaus.
* k=1: ~0.84
* k=2: ~0.89
* k=3: ~0.91
* k=4: ~0.92
* k=5-10: ~0.92-0.93 (plateau)
* **majority@k:** This line (maroon) starts at a lower accuracy and increases more gradually.
* k=1: ~0.84
* k=2: ~0.86
* k=3: ~0.87
* k=4: ~0.88
* k=5: ~0.89
* k=6: ~0.90
* k=7: ~0.91
* k=8: ~0.91
* k=9: ~0.92
* k=10: ~0.92
* **short-1@k (Ours):** This line (blue) exhibits a steep increase in accuracy from k=1 to k=4, then a slight decrease.
* k=1: ~0.84
* k=2: ~0.88
* k=3: ~0.91
* k=4: ~0.92
* k=5: ~0.92
* k=6: ~0.92
* k=7: ~0.92
* k=8: ~0.91
* k=9: ~0.90
* k=10: ~0.88
* **short-3@k (Ours):** This line (teal) shows a similar trend to short-1@k, with a rapid increase initially, followed by a plateau and a slight decrease.
* k=1: ~0.84
* k=2: ~0.89
* k=3: ~0.91
* k=4: ~0.92
* k=5: ~0.92
* k=6: ~0.92
* k=7: ~0.92
* k=8: ~0.92
* k=9: ~0.91
* k=10: ~0.89
### Key Observations
* The "pass@k (Oracle)" method consistently achieves the highest accuracy across all sample sizes.
* Both "short-1@k (Ours)" and "short-3@k (Ours)" methods demonstrate significant improvements in accuracy as the sample size increases, reaching comparable levels to "pass@k (Oracle)" at k=4.
* The "majority@k" method exhibits the slowest improvement in accuracy and remains the lowest performing method throughout.
* "short-1@k (Ours)" and "short-3@k (Ours)" show a slight decrease in accuracy at k=9 and k=10, suggesting a potential overfitting or diminishing returns with larger sample sizes.
### Interpretation
The chart demonstrates the effectiveness of the proposed "short-1@k" and "short-3@k" methods in achieving high accuracy, particularly when compared to the "majority@k" baseline. The performance of these methods approaches that of the "pass@k (Oracle)" method, which represents an ideal scenario with complete information. The plateauing and slight decline in accuracy for "short-1@k" and "short-3@k" at larger sample sizes suggest that the benefits of increasing the sample size diminish beyond a certain point, and may even introduce noise or overfitting. The rapid initial gains indicate that these methods are sensitive to the quality and relevance of the initial samples. The difference between "short-1@k" and "short-3@k" is minimal, suggesting that increasing the number of short contexts from 1 to 3 does not yield substantial performance gains. This data suggests that the proposed methods are a viable alternative to the Oracle method, offering a good trade-off between accuracy and computational cost.