## Line Chart: Accuracy vs. Sample Size (k)
### Overview
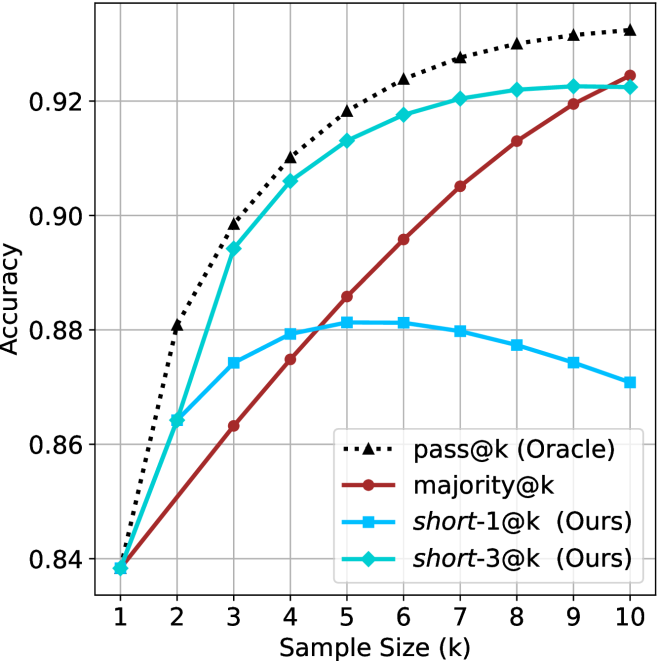
The chart compares the accuracy of four methods (pass@k, majority@k, short-1@k, short-3@k) across sample sizes from 1 to 10. Accuracy is measured on the y-axis (0.84–0.92), while the x-axis represents sample size (k). The legend is positioned in the bottom-right corner, with distinct colors and markers for each method.
### Components/Axes
- **X-axis (Sample Size, k)**: Labeled "Sample Size (k)" with ticks from 1 to 10.
- **Y-axis (Accuracy)**: Labeled "Accuracy" with values from 0.84 to 0.92.
- **Legend**: Located in the bottom-right corner, with the following entries:
- **pass@k (Oracle)**: Black dashed line with triangle markers.
- **majority@k**: Red solid line with square markers.
- **short-1@k (Ours)**: Blue solid line with circle markers.
- **short-3@k (Ours)**: Green solid line with diamond markers.
### Detailed Analysis
1. **pass@k (Oracle)**:
- Starts at 0.84 (k=1) and increases steadily to 0.92 (k=10).
- Shows a consistent upward trend with no fluctuations.
- **Key data points**:
- k=1: 0.84
- k=5: ~0.90
- k=10: 0.92
2. **majority@k**:
- Starts at 0.84 (k=1) and increases gradually to 0.92 (k=10).
- Slightly less steep than pass@k but follows a similar upward trajectory.
- **Key data points**:
- k=1: 0.84
- k=5: ~0.88
- k=10: 0.92
3. **short-1@k (Ours)**:
- Starts at 0.86 (k=1) and peaks at ~0.88 (k=5).
- Declines slightly to 0.87 (k=10), showing a dip after k=5.
- **Key data points**:
- k=1: 0.86
- k=5: ~0.88
- k=10: 0.87
4. **short-3@k (Ours)**:
- Starts at 0.84 (k=1) and increases sharply to 0.92 (k=10).
- Outperforms majority@k and short-1@k for larger k values.
- **Key data points**:
- k=1: 0.84
- k=5: ~0.90
- k=10: 0.92
### Key Observations
- **pass@k (Oracle)** achieves the highest accuracy across all sample sizes, maintaining a steady increase.
- **short-3@k (Ours)** closely follows pass@k, showing the most significant improvement with larger k.
- **short-1@k (Ours)** exhibits a peak at k=5 but declines afterward, suggesting potential overfitting or inefficiency at larger sample sizes.
- **majority@k** performs the worst, with a slower and less consistent increase in accuracy.
### Interpretation
The data highlights that **pass@k (Oracle)** is the most reliable method, achieving the highest accuracy (0.92 at k=10). **short-3@k (Ours)** is a close second, demonstrating strong scalability with larger sample sizes. In contrast, **short-1@k (Ours)** underperforms at larger k, raising questions about its robustness. The **majority@k** method, while improving with k, remains the least effective, indicating that majority voting may not be optimal for this task. The divergence between short-1@k and short-3@k suggests that the choice of method significantly impacts performance, particularly as sample size increases. This could inform decisions about method selection in scenarios where sample size varies.