## Pie Charts: Error Distribution Across Datasets
### Overview
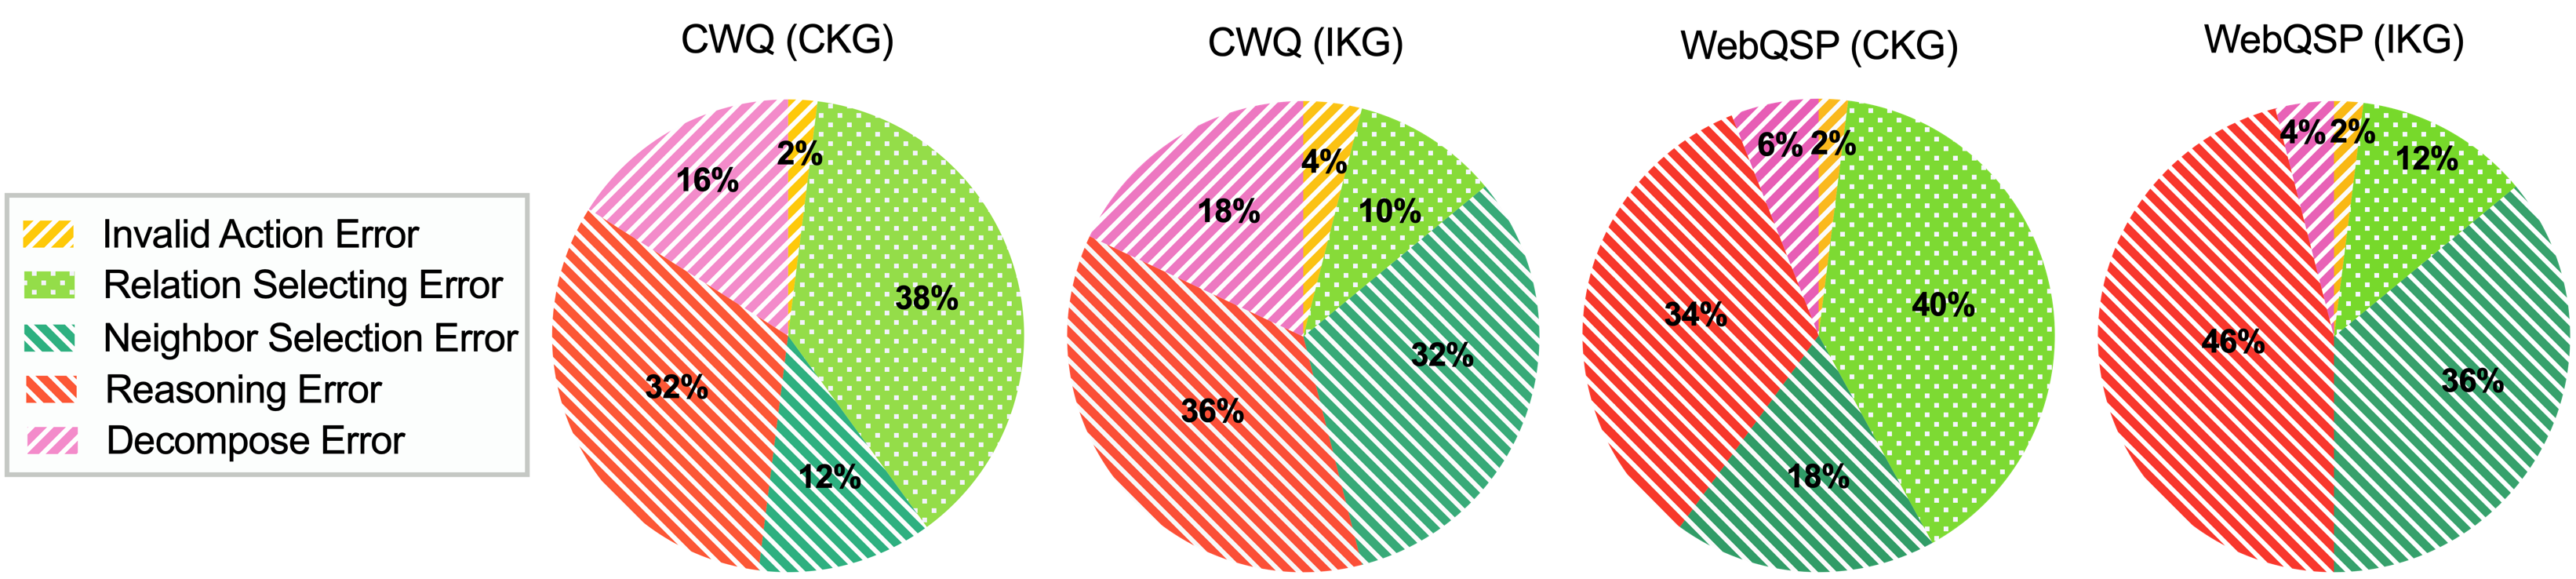
The image contains four pie charts comparing error distributions across four datasets: CWQ (CKG), CWQ (IKG), WebQSP (CKG), and WebQSP (IKG). Each chart uses a consistent color-coded legend to represent five error types: Invalid Action Error (yellow), Relation Selecting Error (green), Neighbor Selection Error (teal), Reasoning Error (red), and Decompose Error (pink). The charts are arranged in a 2x2 grid with a shared legend on the left.
### Components/Axes
- **Legend**: Positioned in the top-left corner, with five error types mapped to colors:
- Invalid Action Error: Yellow (striped)
- Relation Selecting Error: Green (dotted)
- Neighbor Selection Error: Teal (striped)
- Reasoning Error: Red (striped)
- Decompose Error: Pink (striped)
- **Charts**: Four pie charts labeled with dataset names (e.g., "CWQ (CKG)") positioned to the right of the legend. Each chart segment is labeled with a percentage.
### Detailed Analysis
#### CWQ (CKG)
- **Relation Selecting Error**: 38% (green, largest segment)
- **Reasoning Error**: 32% (red)
- **Decompose Error**: 16% (pink)
- **Neighbor Selection Error**: 12% (teal)
- **Invalid Action Error**: 2% (yellow)
#### CWQ (IKG)
- **Reasoning Error**: 36% (red)
- **Neighbor Selection Error**: 32% (teal)
- **Decompose Error**: 18% (pink)
- **Relation Selecting Error**: 10% (green)
- **Invalid Action Error**: 4% (yellow)
#### WebQSP (CKG)
- **Reasoning Error**: 34% (red)
- **Relation Selecting Error**: 40% (green)
- **Neighbor Selection Error**: 16% (teal)
- **Decompose Error**: 6% (pink)
- **Invalid Action Error**: 2% (yellow)
#### WebQSP (IKG)
- **Reasoning Error**: 46% (red, largest segment)
- **Neighbor Selection Error**: 36% (teal)
- **Relation Selecting Error**: 12% (green)
- **Decompose Error**: 4% (pink)
- **Invalid Action Error**: 2% (yellow)
### Key Observations
1. **Reasoning Errors Dominate WebQSP (IKG)**: At 46%, this is the highest error rate across all datasets.
2. **Relation Selecting Errors Peak in CWQ (CKG)**: 38% of errors here, significantly higher than other datasets.
3. **Invalid Action Errors Consistently Minimal**: Never exceeds 4% in any dataset.
4. **Decompose Errors Decrease in WebQSP (IKG)**: Only 4%, the lowest among all error types.
### Interpretation
The data suggests that error distributions vary significantly between datasets and error types. WebQSP (IKG) exhibits a strong emphasis on Reasoning Errors (46%), potentially indicating challenges in logical processing or inference tasks for this dataset. In contrast, CWQ (CKG) shows a higher prevalence of Relation Selecting Errors (38%), suggesting difficulties in identifying or categorizing relationships within its data. The minimal Invalid Action Errors (≤4%) across all datasets imply robust validation mechanisms or well-defined action constraints. The stark contrast between WebQSP (IKG) and other datasets highlights the need for dataset-specific error mitigation strategies.