\n
## Line Chart: Performance Comparison of DNN and RNNN
### Overview
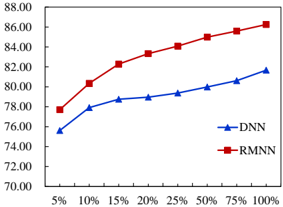
The image presents a line chart comparing the performance of two models, DNN (Deep Neural Network) and RNNN (Recurrent Neural Network with Memory Networks), across varying percentages of data. The performance is measured on the y-axis, ranging from 70.00 to 88.00, while the data percentage is represented on the x-axis, ranging from 5% to 100%.
### Components/Axes
* **X-axis Title:** Data Percentage
* **X-axis Markers:** 5%, 10%, 15%, 20%, 25%, 50%, 75%, 100%
* **Y-axis Title:** Performance (Units not specified)
* **Y-axis Scale:** 70.00 to 88.00, with increments of 2.00
* **Legend:** Located in the top-right corner.
* **DNN:** Represented by a blue line with downward-pointing triangle markers.
* **RMNN:** Represented by a red line with square markers.
### Detailed Analysis
**RMNN (Red Line):** The RMNN line exhibits a consistent upward trend throughout the entire range of data percentages.
* At 5% data, the performance is approximately 77.00.
* At 10% data, the performance is approximately 80.00.
* At 15% data, the performance is approximately 82.00.
* At 20% data, the performance is approximately 82.50.
* At 25% data, the performance is approximately 83.00.
* At 50% data, the performance is approximately 84.00.
* At 75% data, the performance is approximately 85.00.
* At 100% data, the performance is approximately 86.50.
**DNN (Blue Line):** The DNN line also shows an upward trend, but it is less steep than the RMNN line.
* At 5% data, the performance is approximately 76.00.
* At 10% data, the performance is approximately 77.50.
* At 15% data, the performance is approximately 78.50.
* At 20% data, the performance is approximately 79.00.
* At 25% data, the performance is approximately 79.50.
* At 50% data, the performance is approximately 80.00.
* At 75% data, the performance is approximately 81.00.
* At 100% data, the performance is approximately 82.50.
### Key Observations
* RMNN consistently outperforms DNN across all data percentages.
* The performance gap between RMNN and DNN widens as the data percentage increases.
* Both models exhibit diminishing returns in performance as the data percentage approaches 100%. The slope of both lines decreases.
### Interpretation
The data suggests that RMNN is a more effective model than DNN for this particular task, especially when a larger amount of data is available. The increasing performance with increasing data percentage indicates that both models benefit from more data, but RMNN benefits more significantly. The diminishing returns observed at higher data percentages suggest that there may be a point where adding more data provides only marginal improvements in performance. This could be due to factors such as model capacity or the inherent limitations of the data itself. The chart demonstrates a clear trade-off between model complexity (RMNN being more complex) and performance gains with increasing data. The lack of units on the y-axis makes it difficult to interpret the absolute scale of the performance metric, but the relative comparison between the two models is clear.