## Line Graph: Performance Comparison of DNN and RMNN Models
### Overview
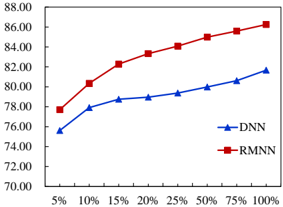
The image depicts a line graph comparing the performance of two models, DNN (Deep Neural Network) and RMNN (Recurrent Model Neural Network), across varying input percentages (5% to 100%). The y-axis represents performance scores (70–88), while the x-axis represents input percentages. Two data series are plotted: RMNN (red squares) and DNN (blue triangles).
### Components/Axes
- **X-Axis (Input Percentage)**: Labeled "5%", "10%", "15%", "20%", "25%", "50%", "75%", "100%".
- **Y-Axis (Performance Score)**: Labeled from 70.00 to 88.00 in increments of 2.00.
- **Legend**: Located at the bottom-right corner.
- **Blue Triangles**: DNN (Deep Neural Network).
- **Red Squares**: RMNN (Recurrent Model Neural Network).
### Detailed Analysis
#### RMNN (Red Squares)
- **Trend**: Steep upward slope, starting at ~78.00 (5%) and rising to ~86.50 (100%).
- **Key Data Points**:
- 5%: ~78.00
- 10%: ~80.00
- 15%: ~82.00
- 20%: ~84.00
- 25%: ~85.00
- 50%: ~85.50
- 75%: ~86.00
- 100%: ~86.50
#### DNN (Blue Triangles)
- **Trend**: Gradual upward slope, starting at ~76.00 (5%) and rising to ~82.00 (100%).
- **Key Data Points**:
- 5%: ~76.00
- 10%: ~77.50
- 15%: ~78.50
- 20%: ~79.00
- 25%: ~79.50
- 50%: ~80.00
- 75%: ~81.00
- 100%: ~82.00
### Key Observations
1. **Performance Gap**: RMNN consistently outperforms DNN across all input percentages, with the largest gap at lower percentages (e.g., 5%: ~2.00 difference).
2. **Slope Comparison**: RMNN’s performance increases more sharply than DNN, particularly between 5% and 25%.
3. **Convergence**: The performance gap narrows slightly at higher percentages (e.g., 100%: ~4.50 difference), but RMNN remains superior.
### Interpretation
The data suggests that RMNN demonstrates significantly better performance than DNN as input percentages increase. The steeper slope of RMNN indicates it may be more sensitive to input variability or better at leveraging larger datasets. However, the narrowing gap at higher percentages implies diminishing returns for RMNN’s advantage. This could reflect architectural differences (e.g., RMNN’s recurrent design vs. DNN’s static structure) or dataset-specific optimizations. Further investigation into the input data characteristics and model training parameters would clarify these trends.