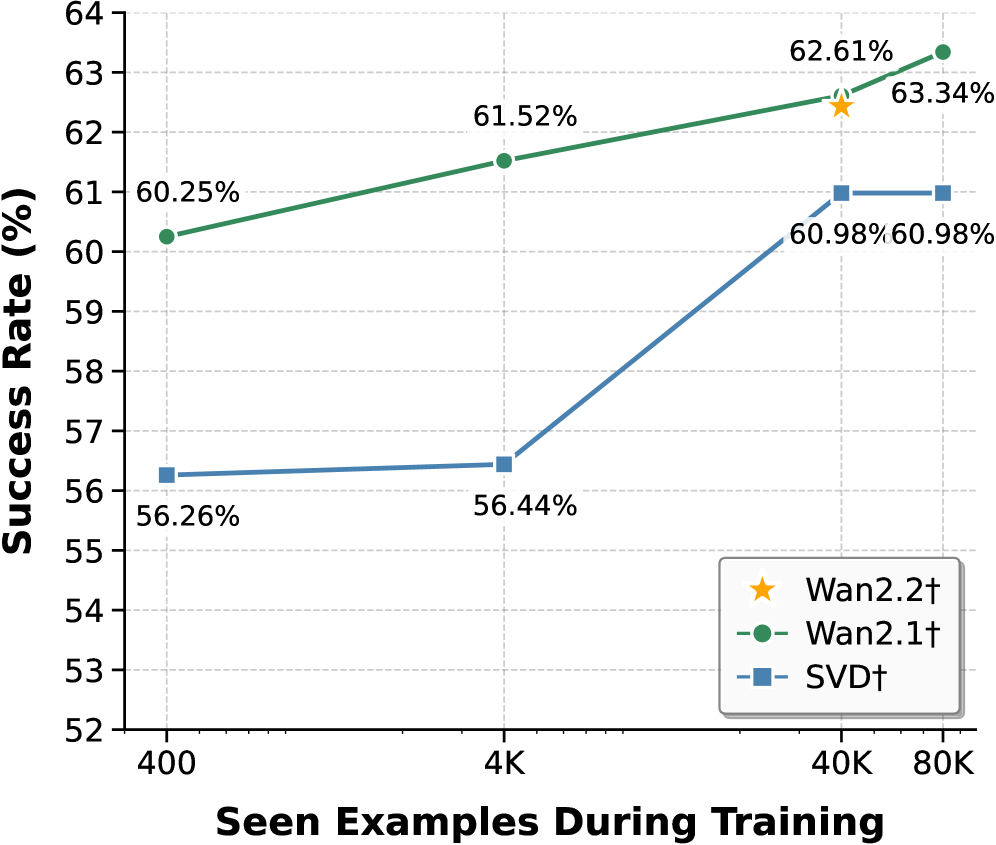
## Line Chart: Success Rate vs. Seen Examples During Training
### Overview
The image is a line chart comparing the success rates of three different models (Wan2.2, Wan2.1, and SVD) as a function of the number of seen examples during training. The x-axis represents the number of seen examples during training, while the y-axis represents the success rate in percentage.
### Components/Axes
* **X-axis:** "Seen Examples During Training" with markers at 400, 4K, 40K, and 80K.
* **Y-axis:** "Success Rate (%)" with a scale from 52 to 64, incrementing by 1.
* **Legend:** Located in the bottom-right corner.
* Wan2.2† (represented by a yellow star)
* Wan2.1† (represented by a green circle)
* SVD† (represented by a blue square)
### Detailed Analysis
* **Wan2.1† (Green Line):** The line slopes upward.
* At 400 seen examples, the success rate is 60.25%.
* At 4K seen examples, the success rate is 61.52%.
* At 40K seen examples, the success rate is 62.61%.
* At 80K seen examples, the success rate is 63.34%.
* **SVD† (Blue Line):** The line slopes upward until 40K, then plateaus.
* At 400 seen examples, the success rate is 56.26%.
* At 4K seen examples, the success rate is 56.44%.
* At 40K seen examples, the success rate is 60.98%.
* At 80K seen examples, the success rate is 60.98%.
* **Wan2.2† (Yellow Star):** Only one data point is shown.
* At 40K seen examples, the success rate is 62.61%.
### Key Observations
* Wan2.1 consistently outperforms SVD across all tested numbers of seen examples.
* SVD's performance plateaus after 40K seen examples.
* Wan2.2 has a single data point at 40K, matching the performance of Wan2.1 at that point.
### Interpretation
The chart suggests that Wan2.1 is a more effective model than SVD, as it achieves higher success rates with the same amount of training data. The plateau in SVD's performance indicates that it may have reached its learning capacity with the given dataset or architecture. The single data point for Wan2.2 at 40K suggests it may be a variant or configuration of Wan2.1, achieving similar performance at that specific training level. The dagger symbol "†" next to each model name may indicate a specific version or configuration.