## Diagram: Causal Inference Framework for Academic Research
### Overview
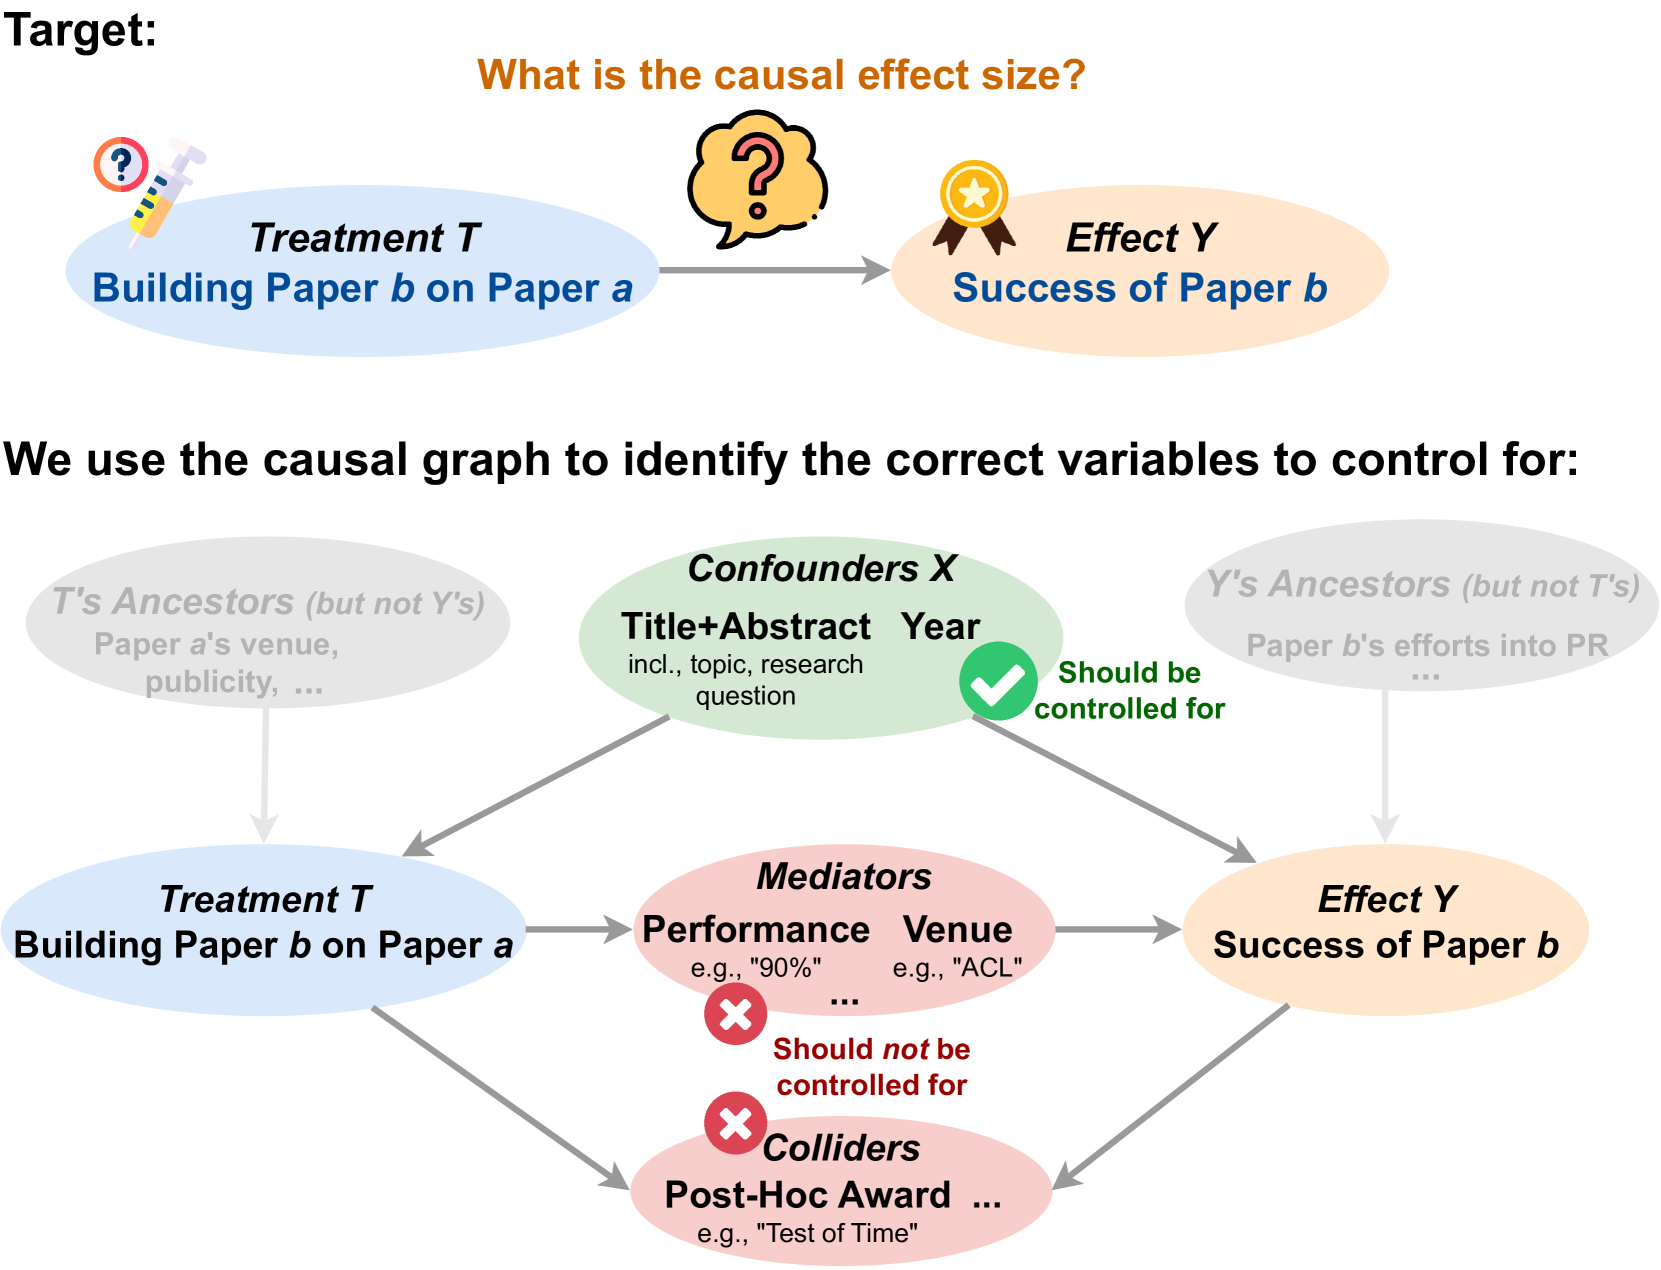
The image is a conceptual diagram illustrating the methodology for identifying the causal effect size of one research paper ("Paper b") building upon another ("Paper a"). It serves as a guide for researchers to determine which variables should be controlled for (confounders) and which should be excluded (mediators and colliders) when performing causal analysis on academic bibliometric data.
### Components/Axes
The diagram is divided into two main sections:
1. **Top Section (Target):** Defines the research question.
2. **Bottom Section (Causal Graph):** A directed acyclic graph (DAG) mapping the relationships between variables.
**Color Coding & Legend:**
* **Blue Ovals:** Treatment variables (Treatment T).
* **Orange Ovals:** Outcome variables (Effect Y).
* **Green Oval:** Variables that *should* be controlled for (Confounders).
* **Red Ovals:** Variables that *should not* be controlled for (Mediators and Colliders).
* **Grey Ovals:** Ancestor variables (exogenous factors).
* **Icons:**
* **Syringe:** Represents "Treatment".
* **Question Mark:** Represents uncertainty/causal inquiry.
* **Medal:** Represents "Success" or "Effect".
* **Green Checkmark:** Indicates a recommended action (Control).
* **Red X:** Indicates a prohibited action (Do not control).
### Detailed Analysis
#### 1. Top Section: The Target
* **Text:** "Target: What is the causal effect size?"
* **Visual Flow:** A blue oval labeled "Treatment T: Building Paper b on Paper a" points via an arrow to an orange oval labeled "Effect Y: Success of Paper b".
* **Context:** A syringe icon sits above the Treatment, and a medal icon sits above the Effect. A thought bubble with a question mark sits between them, symbolizing the unknown causal link.
#### 2. Bottom Section: The Causal Graph
This section details the variables influencing the relationship between Treatment T and Effect Y.
* **Confounders X (Top-Center, Green):**
* **Content:** "Title+Abstract", "Year", "incl., topic, research question".
* **Relationship:** Arrows point from this node to both "Treatment T" and "Effect Y".
* **Action:** Marked with a green checkmark and the text "Should be controlled for".
* **T's Ancestors (Top-Left, Grey):**
* **Content:** "Paper a's venue, publicity, ...".
* **Relationship:** Arrow points to "Treatment T".
* **Y's Ancestors (Top-Right, Grey):**
* **Content:** "Paper b's efforts into PR", "...".
* **Relationship:** Arrow points to "Effect Y".
* **Mediators (Center, Red):**
* **Content:** "Performance e.g., '90%'", "Venue e.g., 'ACL'", "...".
* **Relationship:** Arrow points from "Treatment T" to "Mediators", and from "Mediators" to "Effect Y".
* **Action:** Marked with a red 'X' and the text "Should not be controlled for".
* **Colliders (Bottom-Center, Red):**
* **Content:** "Post-Hoc Award ...", "e.g., 'Test of Time'".
* **Relationship:** Arrows point from "Treatment T" and "Effect Y" to "Colliders".
* **Action:** Marked with a red 'X' and the text "Should not be controlled for".
### Key Observations
* **Directionality:** The graph clearly distinguishes between variables that precede the treatment (Confounders/Ancestors), variables that exist on the causal path (Mediators), and variables that are downstream consequences of both the treatment and the effect (Colliders).
* **Strategic Exclusion:** The diagram explicitly warns against controlling for Mediators and Colliders. Controlling for Mediators would block the causal path, while controlling for Colliders would introduce selection bias.
* **Strategic Inclusion:** Only the "Confounders X" node is marked for control, as these variables influence both the treatment and the outcome, creating spurious correlations that must be adjusted to isolate the true causal effect.
### Interpretation
This diagram is a pedagogical tool for causal inference in bibliometrics. It demonstrates that simply including all available variables in a regression model is incorrect.
* **The "Why":**
* **Confounders** must be controlled to remove "backdoor" paths that create false associations.
* **Mediators** must be left alone because they represent the mechanism *through which* the treatment causes the effect; controlling for them would hide the effect you are trying to measure.
* **Colliders** must be left alone because conditioning on them creates a statistical association between the treatment and the outcome that does not exist in reality (collider bias).
The diagram effectively communicates that "Success" (Effect Y) is a complex outcome influenced by both the treatment (building on a paper) and external factors (PR, ancestors), and that rigorous causal analysis requires careful selection of variables based on their position in the causal chain.