## Causal Diagram: Identifying Variables to Control for Estimating Causal Effect Size
### Overview
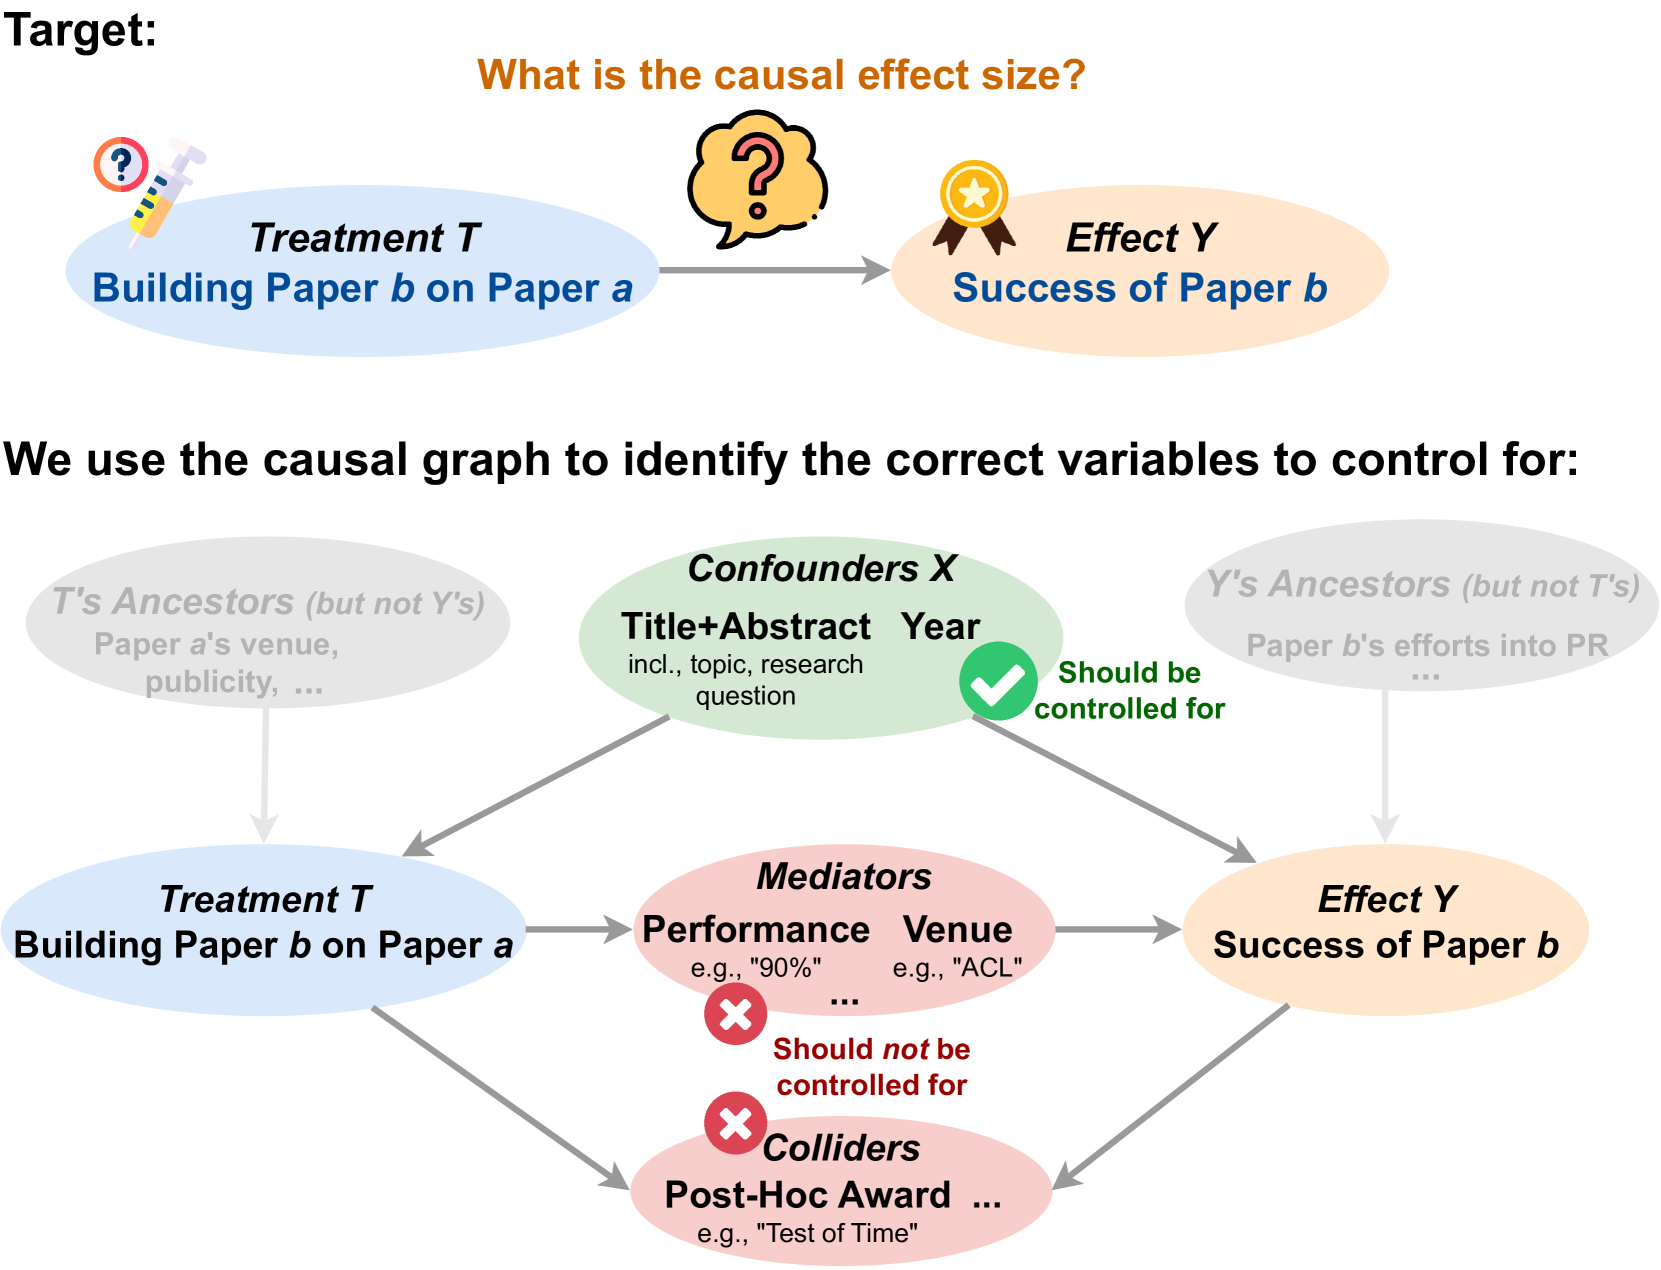
The image is a technical diagram illustrating a causal inference framework. It aims to answer the question: "What is the causal effect size?" of a specific treatment on an outcome within academic research. The diagram uses a causal graph (Directed Acyclic Graph - DAG) to visually identify which variables should and should not be statistically controlled for to obtain an unbiased estimate of the causal effect.
### Components/Axes
The diagram is structured in two main sections:
**1. Top Section (Simplified Target):**
* **Title/Question:** "Target: What is the causal effect size?" (Text in orange).
* **Treatment Node (T):** A blue oval labeled "**Treatment T**" with the sub-text "**Building Paper *b* on Paper *a***". It is accompanied by an icon of a syringe with a question mark.
* **Effect Node (Y):** An orange oval labeled "**Effect Y**" with the sub-text "**Success of Paper *b***". It is accompanied by an icon of a gold medal/ribbon.
* **Causal Arrow:** A gray arrow points from Treatment T to Effect Y, with a thought bubble containing a question mark above it, symbolizing the unknown causal effect.
**2. Bottom Section (Detailed Causal Graph):**
* **Introductory Text:** "We use the causal graph to identify the correct variables to control for:" (Text in black).
* **Nodes (Variables):**
* **Treatment T (Blue Oval):** Same as above: "**Treatment T / Building Paper *b* on Paper *a***".
* **Effect Y (Orange Oval):** Same as above: "**Effect Y / Success of Paper *b***".
* **Confounders X (Green Oval):** Labeled "**Confounders X**". Contains the text "**Title+Abstract**" and "**Year**". Below, in smaller text: "incl., topic, research question". A green checkmark icon is placed to its right with the text "**Should be controlled for**".
* **Mediators (Pink Oval):** Labeled "**Mediators**". Contains the text "**Performance**" (with example "e.g., '90%'") and "**Venue**" (with example "e.g., 'ACL'"). A red "X" icon is placed below it with the text "**Should *not* be controlled for**".
* **Colliders (Pink Oval):** Labeled "**Colliders**". Contains the text "**Post-Hoc Award ...**" (with example "e.g., 'Test of Time'"). A red "X" icon is placed above it.
* **T's Ancestors (Gray Oval, faded):** Labeled "**T's Ancestors (but not Y's)**". Contains the text "**Paper *a*'s venue, publicity, ...**".
* **Y's Ancestors (Gray Oval, faded):** Labeled "**Y's Ancestors (but not T's)**". Contains the text "**Paper *b*'s efforts into PR ...**".
* **Causal Relationships (Arrows):**
* **Gray Arrows (from faded nodes):** An arrow points from "T's Ancestors" to "Treatment T". An arrow points from "Y's Ancestors" to "Effect Y".
* **Black Arrows (main graph):**
* From "Confounders X" to both "Treatment T" and "Effect Y".
* From "Treatment T" to "Mediators".
* From "Mediators" to "Effect Y".
* From "Treatment T" to "Colliders".
* From "Effect Y" to "Colliders".
### Detailed Analysis
The diagram explicitly defines the variables involved in the research question:
* **Treatment (T):** The act of a new paper (*b*) building upon a prior paper (*a*).
* **Outcome (Y):** The success of the new paper (*b*).
* **Confounders (X):** Variables that influence both the treatment (whether paper *b* builds on *a*) and the outcome (success of *b*). The diagram specifies these include the **Title+Abstract** (encompassing topic and research question) and the **Year**. These **must be controlled for** to block backdoor paths and isolate the causal effect.
* **Mediators:** Variables on the causal pathway from T to Y. The diagram lists **Performance** (e.g., a metric like "90%") and **Venue** (e.g., a conference like "ACL"). Controlling for these would block the very effect one wants to measure, so they **should not be controlled for**.
* **Colliders:** Variables caused by both T and Y. The example given is a **Post-Hoc Award** (e.g., "Test of Time"). Conditioning on colliders opens spurious paths, so they **should not be controlled for**.
* **Ancestors:** Variables that are causes of only T or only Y, but not both (faded in the diagram). These are not confounders and are generally not the focus for control in this specific identification strategy.
### Key Observations
1. **Clear Visual Coding:** The diagram uses color (green for "control", pink/red for "do not control") and icons (checkmark vs. X) to reinforce the analytical rules.
2. **Emphasis on Identification:** The core message is about *variable selection for causal identification*, not measurement. It answers "what to adjust for" before running an analysis.
3. **Contextual Examples:** Abstract concepts are grounded with concrete academic examples (e.g., "ACL" for venue, "Test of Time" for award), making the diagram applicable to scientometrics or research analysis.
4. **Spatial Layout:** The confounders are placed centrally above the main T->Y pathway, visually representing their role in creating a "backdoor" path. Mediators are placed directly on the pathway, and colliders are placed below, receiving arrows from both T and Y.
### Interpretation
This diagram is a pedagogical tool for applying causal inference principles to study the impact of academic lineage (building on prior work) on paper success. It argues that to estimate the true causal effect of "building on paper *a*" on "the success of paper *b*", a researcher must statistically adjust for shared causes like the paper's topic (from Title+Abstract) and its publication year. Adjusting for mediators like the eventual performance score or publication venue would be a mistake, as these are part of the mechanism through which the lineage might exert its effect. Similarly, adjusting for a post-hoc award (a collider) would introduce bias.
The underlying assumption is that the causal effect is identifiable from observational data if the correct set of confounders (X) is measured and adjusted for. The diagram effectively translates a complex statistical concept into a visual map for research design, highlighting common pitfalls (controlling for mediators/colliders) in causal analysis.