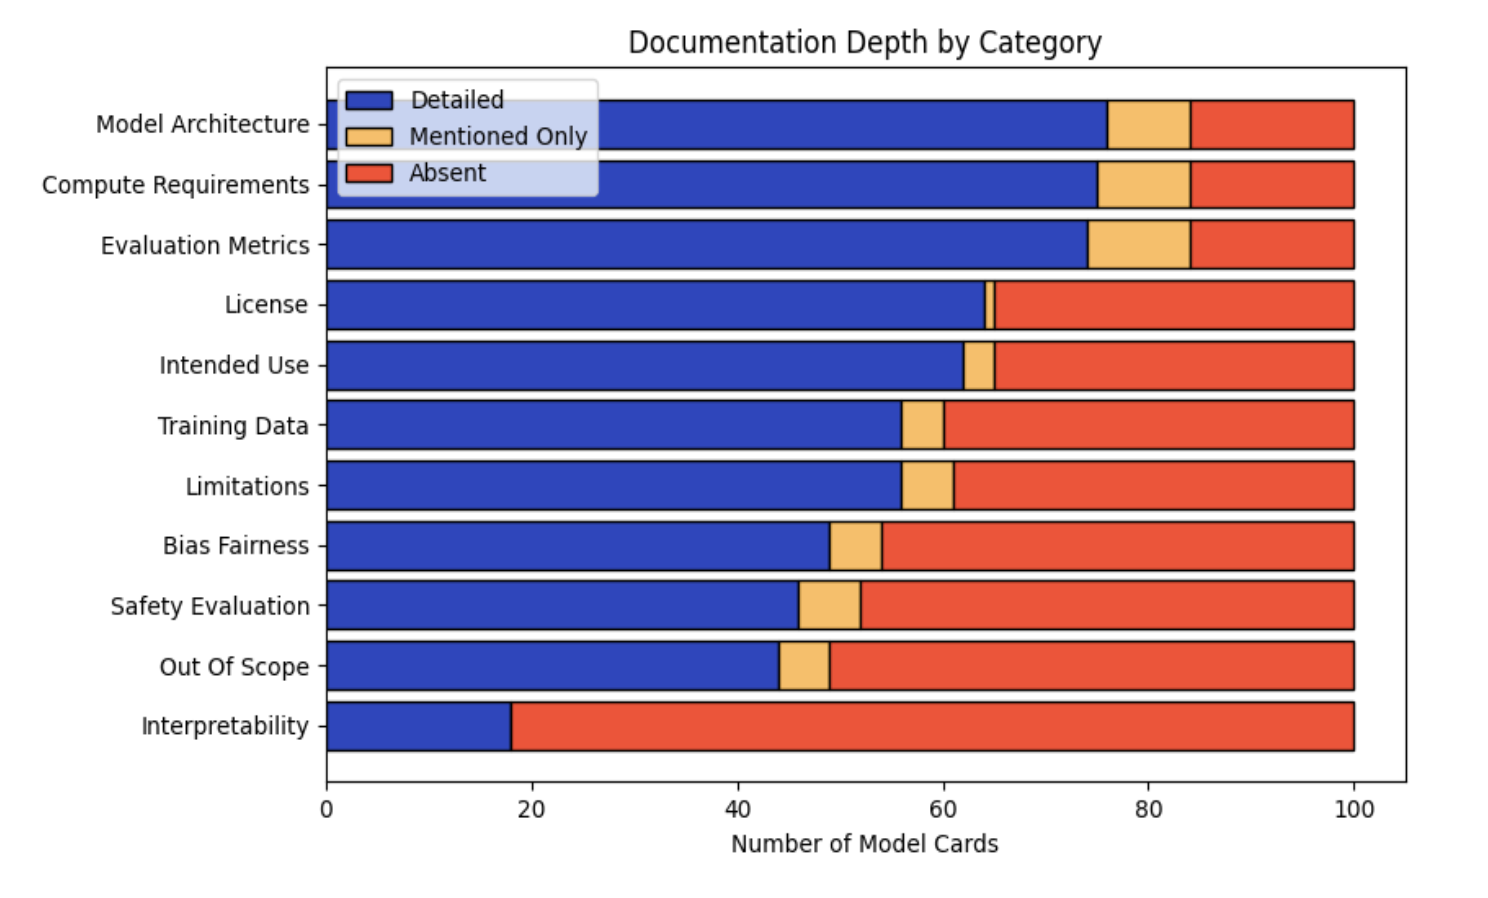
## Horizontal Bar Chart: Documentation Depth by Category
### Overview
The image is a horizontal bar chart illustrating the documentation depth for various categories related to model cards. The chart compares the number of model cards that have "Detailed," "Mentioned Only," or "Absent" documentation for each category. The categories are listed on the vertical axis, and the number of model cards is on the horizontal axis, ranging from 0 to 100.
### Components/Axes
* **Title:** Documentation Depth by Category
* **X-Axis:** Number of Model Cards (scale from 0 to 100, with increments of 20)
* **Y-Axis:** Categories (Model Architecture, Compute Requirements, Evaluation Metrics, License, Intended Use, Training Data, Limitations, Bias Fairness, Safety Evaluation, Out Of Scope, Interpretability)
* **Legend:** Located at the top-left of the chart.
* Blue: Detailed
* Yellow/Orange: Mentioned Only
* Red: Absent
### Detailed Analysis
Here's a breakdown of the documentation depth for each category:
* **Model Architecture:**
* Detailed (Blue): ~75
* Mentioned Only (Yellow/Orange): ~10
* Absent (Red): ~15
* **Compute Requirements:**
* Detailed (Blue): ~75
* Mentioned Only (Yellow/Orange): ~10
* Absent (Red): ~15
* **Evaluation Metrics:**
* Detailed (Blue): ~75
* Mentioned Only (Yellow/Orange): ~10
* Absent (Red): ~15
* **License:**
* Detailed (Blue): ~60
* Absent (Red): ~40
* **Intended Use:**
* Detailed (Blue): ~60
* Mentioned Only (Yellow/Orange): ~5
* Absent (Red): ~35
* **Training Data:**
* Detailed (Blue): ~60
* Mentioned Only (Yellow/Orange): ~5
* Absent (Red): ~35
* **Limitations:**
* Detailed (Blue): ~60
* Mentioned Only (Yellow/Orange): ~5
* Absent (Red): ~35
* **Bias Fairness:**
* Detailed (Blue): ~50
* Mentioned Only (Yellow/Orange): ~10
* Absent (Red): ~40
* **Safety Evaluation:**
* Detailed (Blue): ~50
* Mentioned Only (Yellow/Orange): ~10
* Absent (Red): ~40
* **Out Of Scope:**
* Detailed (Blue): ~45
* Mentioned Only (Yellow/Orange): ~5
* Absent (Red): ~50
* **Interpretability:**
* Detailed (Blue): ~15
* Absent (Red): ~85
### Key Observations
* "Model Architecture," "Compute Requirements," and "Evaluation Metrics" have the highest proportion of "Detailed" documentation.
* "Interpretability" has the lowest proportion of "Detailed" documentation and the highest proportion of "Absent" documentation.
* "License," "Intended Use," "Training Data," "Limitations," "Bias Fairness," and "Safety Evaluation" have a significant portion of "Absent" documentation.
* "Out of Scope" has nearly equal "Detailed" and "Absent" documentation.
### Interpretation
The chart reveals significant variations in documentation depth across different categories of model cards. Categories like "Model Architecture," "Compute Requirements," and "Evaluation Metrics" are generally well-documented, with a large proportion of model cards providing detailed information. In contrast, "Interpretability" is poorly documented, with most model cards lacking detailed information. This suggests that interpretability aspects of models are often overlooked or not thoroughly documented. The relatively high proportion of "Absent" documentation for categories like "License," "Intended Use," "Training Data," and "Limitations" indicates potential areas for improvement in model card documentation practices. The data highlights the need for a more consistent and comprehensive approach to documenting all relevant aspects of machine learning models.