## Horizontal Bar Chart: Documentation Depth by Category
### Overview
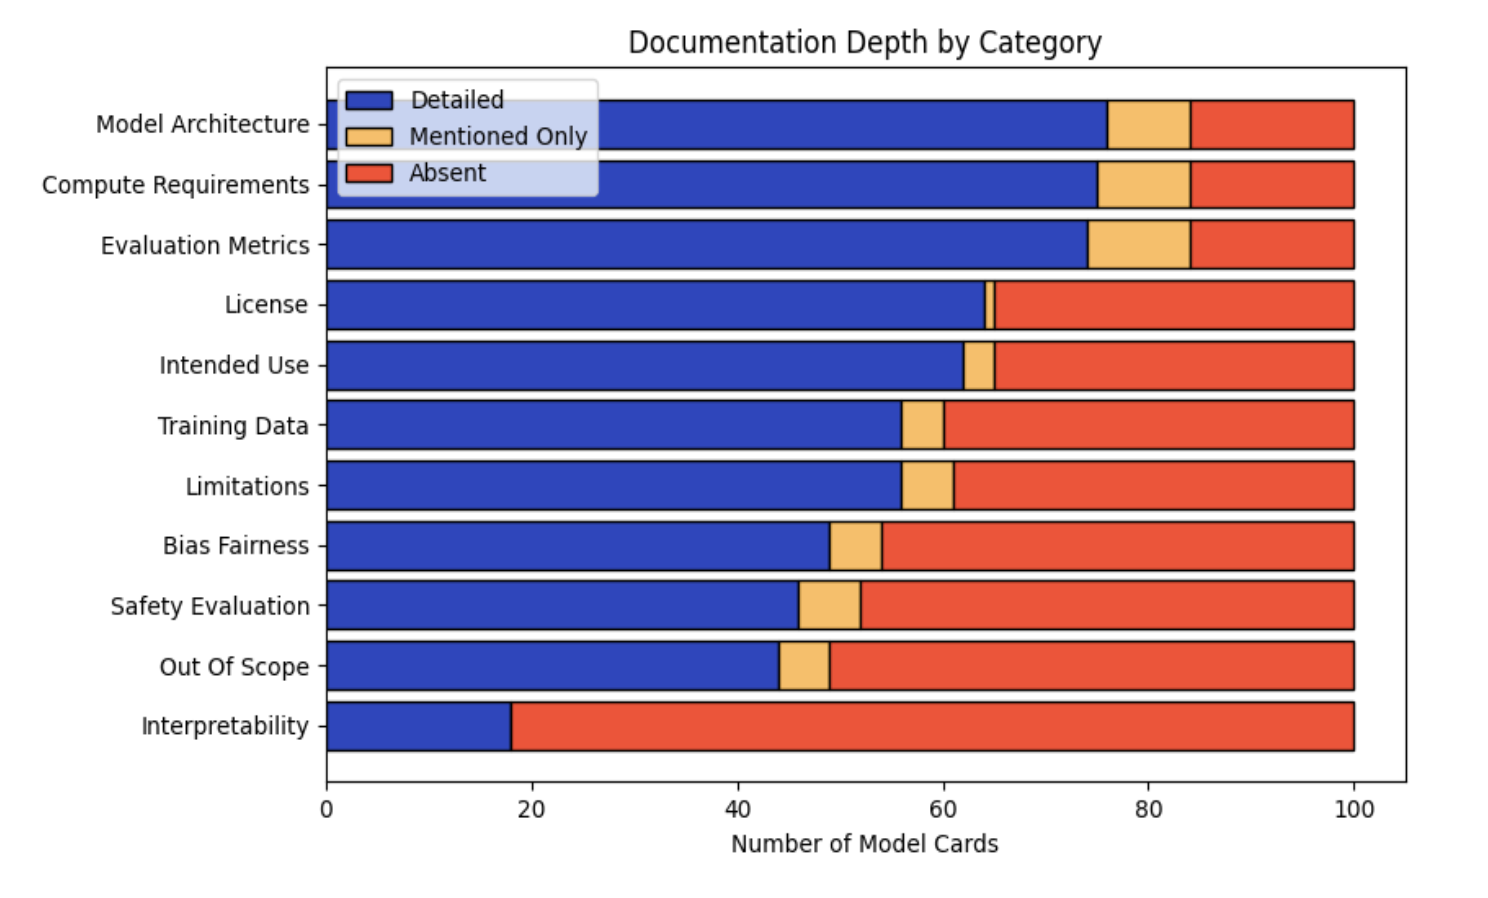
The chart visualizes the depth of documentation across 12 categories related to AI/ML model cards. Each category is represented by a horizontal bar segmented into three colors: blue ("Detailed"), orange ("Mentioned Only"), and red ("Absent"). The x-axis quantifies documentation coverage (0–100), while the y-axis lists categories in descending order of "Detailed" documentation.
### Components/Axes
- **X-axis**: "Number of Model Cards" (0–100, linear scale)
- **Y-axis**: Categories (Model Architecture, Compute Requirements, Evaluation Metrics, License, Intended Use, Training Data, Limitations, Bias Fairness, Safety Evaluation, Out Of Scope, Interpretability)
- **Legend**:
- Blue = Detailed
- Orange = Mentioned Only
- Red = Absent
- **Spatial Layout**:
- Legend positioned in the top-left corner
- Bars aligned horizontally, descending from top (Model Architecture) to bottom (Interpretability)
### Detailed Analysis
1. **Model Architecture**:
- Detailed: ~75 (blue)
- Mentioned Only: ~10 (orange)
- Absent: ~15 (red)
2. **Compute Requirements**:
- Detailed: ~75 (blue)
- Mentioned Only: ~10 (orange)
- Absent: ~15 (red)
3. **Evaluation Metrics**:
- Detailed: ~70 (blue)
- Mentioned Only: ~10 (orange)
- Absent: ~20 (red)
4. **License**:
- Detailed: ~65 (blue)
- Mentioned Only: ~5 (orange)
- Absent: ~30 (red)
5. **Intended Use**:
- Detailed: ~60 (blue)
- Mentioned Only: ~5 (orange)
- Absent: ~35 (red)
6. **Training Data**:
- Detailed: ~55 (blue)
- Mentioned Only: ~5 (orange)
- Absent: ~40 (red)
7. **Limitations**:
- Detailed: ~55 (blue)
- Mentioned Only: ~5 (orange)
- Absent: ~40 (red)
8. **Bias Fairness**:
- Detailed: ~50 (blue)
- Mentioned Only: ~5 (orange)
- Absent: ~45 (red)
9. **Safety Evaluation**:
- Detailed: ~45 (blue)
- Mentioned Only: ~5 (orange)
- Absent: ~50 (red)
10. **Out Of Scope**:
- Detailed: ~45 (blue)
- Mentioned Only: ~5 (orange)
- Absent: ~50 (red)
11. **Interpretability**:
- Detailed: ~20 (blue)
- Mentioned Only: ~0 (orange)
- Absent: ~80 (red)
### Key Observations
- **Trend Verification**:
- Blue bars ("Detailed") decrease monotonically from top to bottom (75 → 20).
- Red bars ("Absent") increase monotonically (15 → 80).
- Orange bars ("Mentioned Only") remain consistently low (~5–10) except for License (~5) and Intended Use (~5).
- **Notable Outliers**:
- Interpretability has the lowest "Detailed" documentation (~20) and highest "Absent" (~80).
- License and Intended Use show minimal "Mentioned Only" documentation.
### Interpretation
The data suggests a systematic decline in detailed documentation quality as categories progress from technical specifications (Model Architecture) to ethical considerations (Interpretability). Critical gaps appear in:
1. **Ethical/Ethical-Related Categories**:
- Bias Fairness, Safety Evaluation, and Interpretability show significant "Absent" documentation (>45).
2. **Implementation-Specific Categories**:
- Compute Requirements and Evaluation Metrics maintain high "Detailed" coverage but lack depth in "Mentioned Only" segments.
3. **Structural Gaps**:
- License and Interpretability categories exhibit the largest documentation voids, raising concerns about compliance and model transparency.
The chart underscores a prioritization of technical documentation over ethical and operational aspects, with Interpretability being the most neglected area. This pattern may reflect resource allocation biases or underestimation of interpretability's importance in model deployment.