## Diagram: Network of Temperature Explanations
### Overview
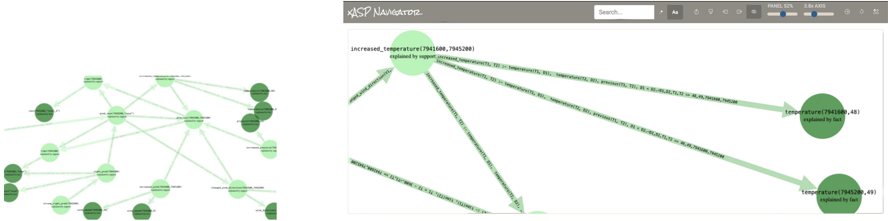
The image presents a network diagram illustrating relationships between temperature increases and related factors. The diagram is split into two main sections: a broader network on the left and a zoomed-in view on the right, focusing on the explanation of increased temperature. Nodes represent temperature-related events or states, and edges (arrows) indicate causal or explanatory relationships.
### Components/Axes
* **Nodes:** Represented by circles, with labels indicating the type of temperature event and associated numerical identifiers (likely coordinates or IDs). Node color varies in shades of green, possibly indicating a degree of severity or importance.
* **Edges:** Represented by arrows, indicating the direction of influence or explanation.
* **Header:** Contains the title "XASP NAVIGATOR", a search bar, and controls labeled "Aa", "PANEL 52%", and "3.6x ADS".
### Detailed Analysis
**Left Side (Broader Network):**
* The left side shows a network of interconnected nodes.
* Nodes are labeled with terms like "increased temperature", "temperature", and other related concepts.
* Node colors vary from light green to dark green.
* Arrows connect the nodes, indicating relationships between them.
**Right Side (Zoomed-In View):**
* The right side provides a detailed view of the "increased\_temperature(7941600, 7945200)" node.
* This node is labeled as "explained by support increased\_temperature(T1, T2) :- temperature(T1, B1), temperature(T2, B2), previous(T1, T2), B1 == 85, B2 == 86, T1, T2 == 48, 7941600, 7945200".
* Arrows point from this node to two other nodes:
* "temperature(7941600, 48) explained by fact"
* "temperature(7945200, 49) explained by fact"
* The arrows are labeled with conditions such as "B1 == 85, B2 == 86, T1, T2 == 48, 7941600, 7945200" and "B1 == 85, B2 == 86, T1, T2 == 49, 7941600, 7945200".
### Key Observations
* The diagram illustrates a hierarchical explanation of temperature increases, with a central "increased\_temperature" event being explained by supporting facts related to individual temperature readings.
* The numerical identifiers associated with the nodes likely represent specific locations or timestamps.
* The conditions on the arrows suggest that certain temperature thresholds or relationships between temperature readings are necessary for the "increased\_temperature" event to occur.
### Interpretation
The diagram appears to be a visualization of a knowledge base or reasoning system related to temperature monitoring. It shows how a high-level event ("increased\_temperature") can be explained by lower-level facts ("temperature" readings) and logical rules. The system uses numerical identifiers to track specific temperature events and locations. The zoomed-in view on the right provides a detailed explanation of how the "increased\_temperature" event is derived from the supporting facts and conditions. The network on the left shows how this specific explanation fits into a broader context of temperature-related events and relationships.