## Line Chart: TV Distance vs. Iterations per Trial
### Overview
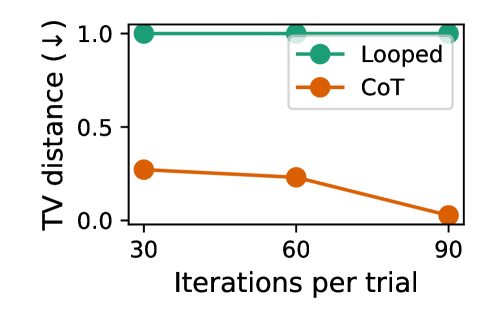
The image is a line chart comparing the Total Variation (TV) distance for two methods, "Looped" and "CoT", across varying iterations per trial. The x-axis represents the number of iterations per trial, while the y-axis represents the TV distance. The chart shows how the TV distance changes as the number of iterations increases for each method.
### Components/Axes
* **X-axis:** "Iterations per trial" with markers at 30, 60, and 90.
* **Y-axis:** "TV distance (↓)" with markers at 0.0, 0.5, and 1.0. The downward arrow indicates that lower TV distance is better.
* **Legend:** Located in the top-right corner.
* "Looped" - Represented by a teal line.
* "CoT" - Represented by an orange line.
### Detailed Analysis
* **Looped (Teal Line):** The TV distance remains constant at approximately 1.0 across all iterations (30, 60, and 90).
* At 30 iterations: TV distance = 1.0
* At 60 iterations: TV distance = 1.0
* At 90 iterations: TV distance = 1.0
* **CoT (Orange Line):** The TV distance decreases as the number of iterations increases.
* At 30 iterations: TV distance ≈ 0.3
* At 60 iterations: TV distance ≈ 0.2
* At 90 iterations: TV distance ≈ 0.0
### Key Observations
* The "Looped" method consistently has a high TV distance, indicating poor performance, regardless of the number of iterations.
* The "CoT" method shows a decreasing TV distance as the number of iterations increases, suggesting improved performance with more iterations.
* At 90 iterations, the "CoT" method achieves a TV distance close to 0.0, significantly outperforming the "Looped" method.
### Interpretation
The chart demonstrates that the "CoT" method's performance, as measured by TV distance, improves with an increasing number of iterations per trial. In contrast, the "Looped" method's performance remains consistently poor, irrespective of the number of iterations. This suggests that the "CoT" method is more effective and benefits from increased computational effort (more iterations), while the "Looped" method is not suitable for this particular task or requires a different approach. The downward arrow on the y-axis indicates that a lower TV distance is desirable, further emphasizing the superior performance of the "CoT" method at higher iteration counts.