\n
## Line Chart: TV Distance vs. Iterations per Trial
### Overview
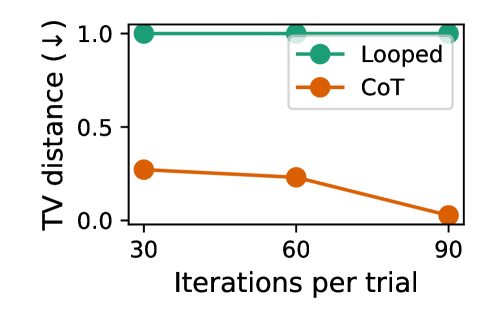
This line chart depicts the relationship between "Iterations per trial" on the x-axis and "TV distance (↓)" on the y-axis. Two data series are presented: "Looped" and "CoT". The chart appears to demonstrate how the TV distance changes as the number of iterations per trial increases for both methods.
### Components/Axes
* **X-axis:** "Iterations per trial" with markers at 30, 60, and 90.
* **Y-axis:** "TV distance (↓)" with a scale ranging from 0.0 to 1.0, incrementing by 0.5. The "↓" symbol suggests a decreasing trend.
* **Legend:** Located in the top-right corner.
* "Looped" - represented by a teal line with teal circular markers.
* "CoT" - represented by an orange line with orange circular markers.
### Detailed Analysis
**Looped (Teal Line):**
The teal line representing "Looped" is nearly horizontal. It starts at approximately 1.0 at 30 iterations, remains at approximately 1.0 at 60 iterations, and remains at approximately 1.0 at 90 iterations.
* (30 Iterations, 1.0)
* (60 Iterations, 1.0)
* (90 Iterations, 1.0)
**CoT (Orange Line):**
The orange line representing "CoT" shows a decreasing trend. It starts at approximately 0.3 at 30 iterations, decreases slightly to approximately 0.3 at 60 iterations, and then decreases more significantly to approximately 0.0 at 90 iterations.
* (30 Iterations, ~0.3)
* (60 Iterations, ~0.3)
* (90 Iterations, ~0.0)
### Key Observations
* The "Looped" method maintains a consistently high TV distance (approximately 1.0) regardless of the number of iterations.
* The "CoT" method exhibits a decreasing TV distance as the number of iterations increases, suggesting convergence or improvement with more iterations.
* The "CoT" method starts with a lower TV distance than the "Looped" method.
### Interpretation
The data suggests that the "Looped" method does not benefit from increased iterations, maintaining a constant TV distance. Conversely, the "CoT" method demonstrates a clear improvement in TV distance with increasing iterations, indicating that it converges towards a more optimal solution. The initial lower TV distance of "CoT" suggests it may be a more efficient method from the start. The "↓" symbol on the y-axis implies that a lower TV distance is desirable. The chart highlights a fundamental difference in the behavior of the two methods as the number of iterations increases. The "Looped" method appears to be stuck in a suboptimal state, while the "CoT" method actively improves. This could be due to the nature of the algorithms themselves, or the specific problem they are being applied to.